Climate Change Chart of Baton Rouge, USA
Comprehensive Climate Change Chart of Baton Rouge, USA: Monthly Averages and Impact Trends
Discover the changing climate trends in Baton Rouge, USA, with insights on temperature, rainfall, snowfall, and sunshine duration.
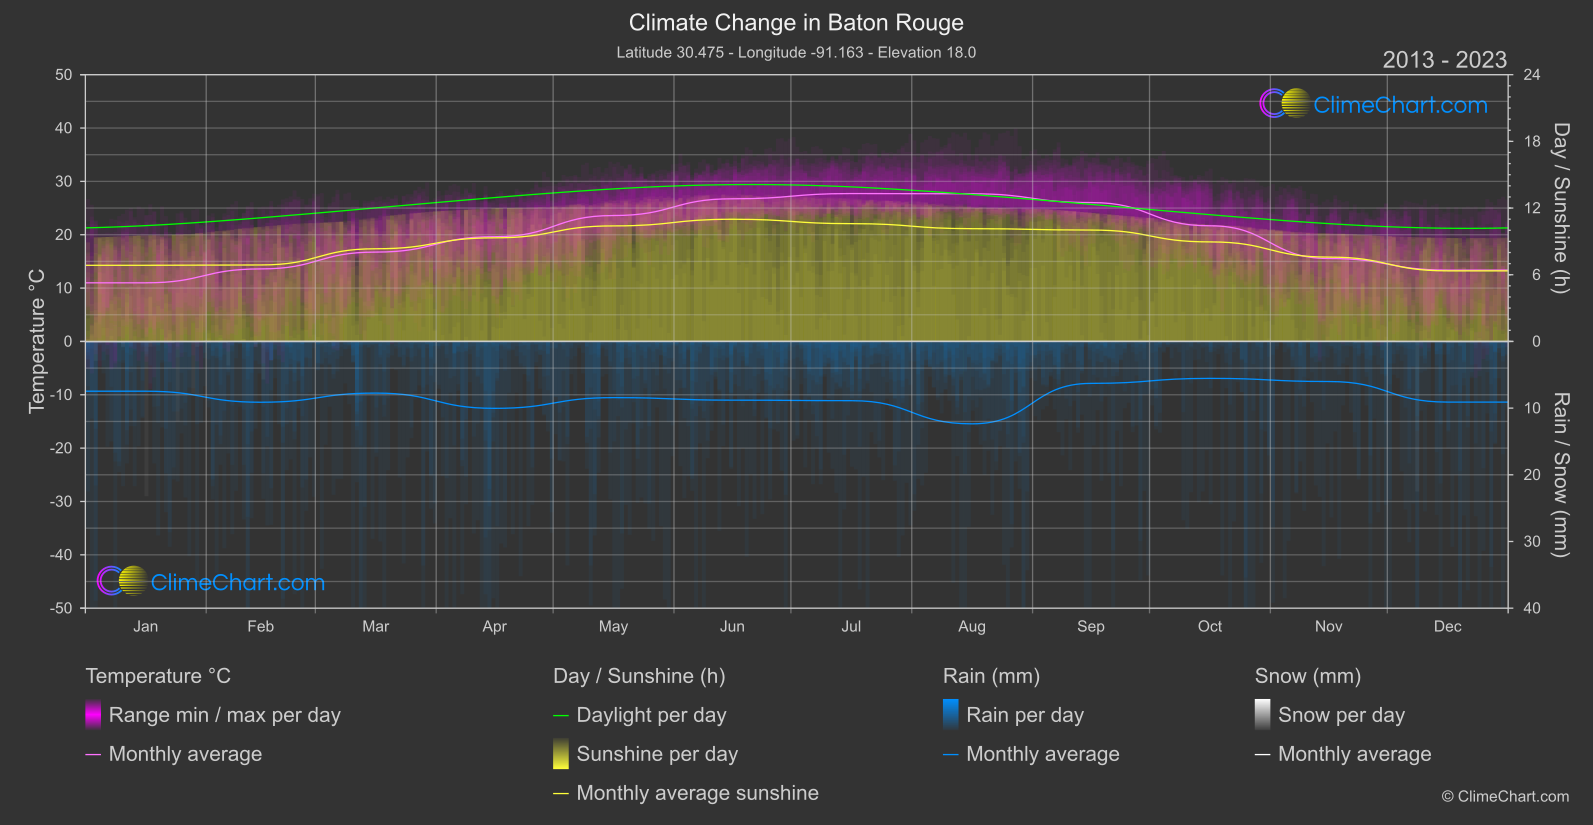
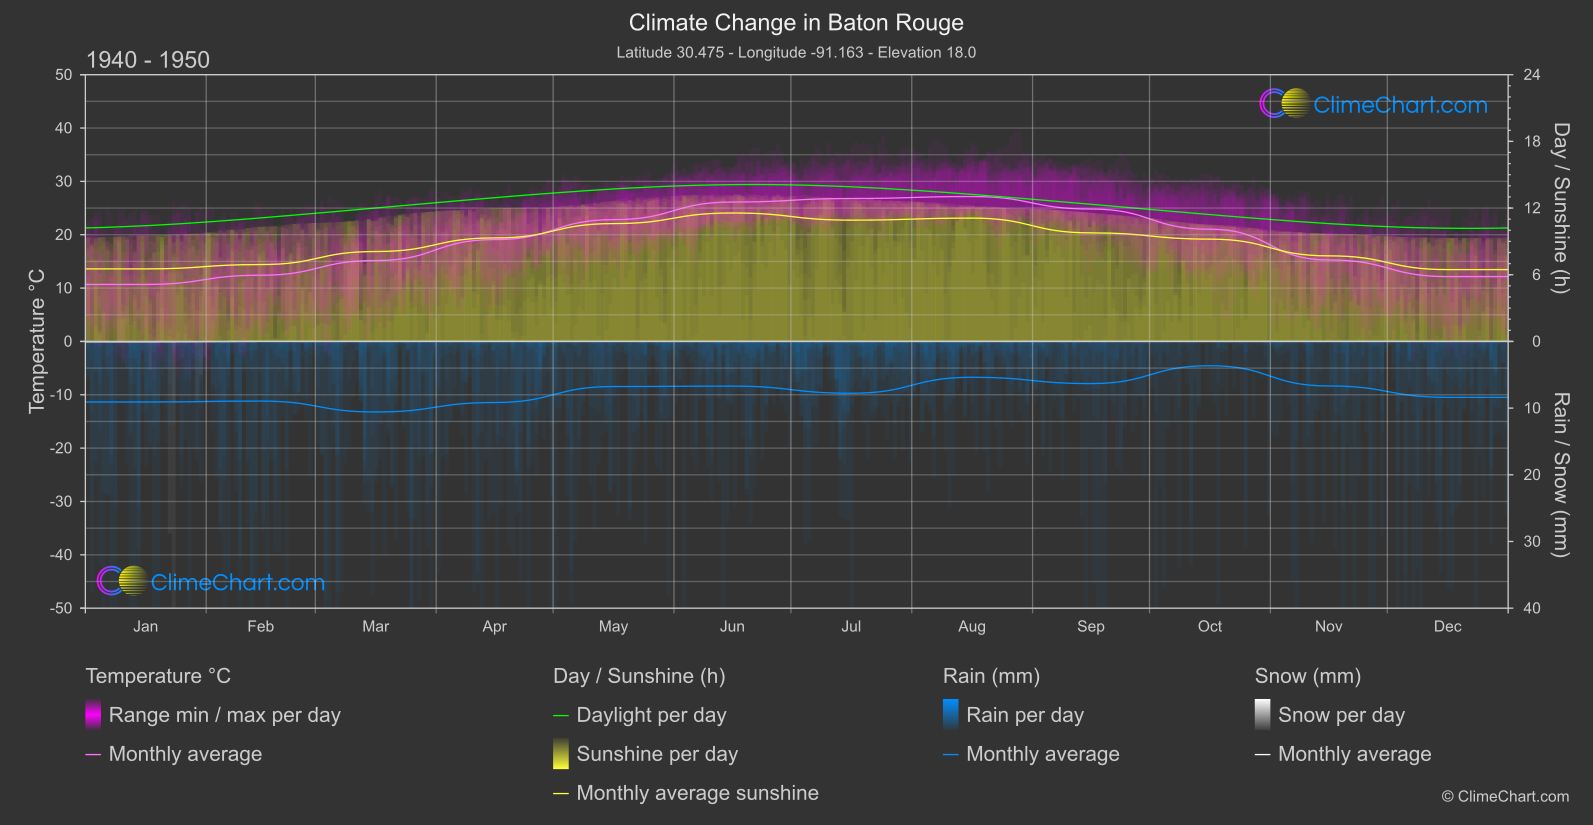
Baton Rouge, USA, has experienced notable changes in climate over the years. From the data collected during the period of 1940-1950 compared to 2013-2024, it is evident that the temperature has increased across various months, with September showing the highest change. In terms of rainfall, August saw the most significant increase, while snowfall remained minimal. Sunshine duration fluctuated over the months, with August experiencing the most notable decrease.
Climate Change Data Overview for Baton Rouge, USA
Explore the comprehensive climate change data for Baton Rouge, USA. This detailed table provides valuable insights into temperature variations, precipitation levels, and seasonal changes influenced by climate change, helping you understand the unique weather patterns of this region.
Temperature °C
| Month | ⌀ 1940 - 1950 | ⌀ 2013 - 2023 | +/- |
|---|---|---|---|
| Jan | 10.68 | 10.99 | 0.31 |
| Feb | 12.41 | 13.59 | 1.18 |
| Mar | 15.16 | 16.75 | 1.59 |
| Apr | 19.09 | 19.63 | 0.54 |
| May | 22.82 | 23.60 | 0.78 |
| Jun | 26.13 | 26.74 | 0.61 |
| Jul | 26.79 | 27.72 | 0.93 |
| Aug | 27.16 | 27.67 | 0.52 |
| Sep | 24.82 | 26.03 | 1.21 |
| Oct | 21.03 | 21.67 | 0.65 |
| Nov | 15.28 | 15.55 | 0.27 |
| Dec | 12.15 | 13.37 | 1.22 |
| ⌀ Month | 19.46 | 20.28 | 0.82 |
Sunshine (h)
| Month | ⌀ 1940 - 1950 | ⌀ 2013 - 2023 | +/- |
|---|---|---|---|
| Jan | 6.53 | 6.85 | 0.33 |
| Feb | 6.92 | 6.88 | -0.04 |
| Mar | 8.09 | 8.34 | 0.25 |
| Apr | 9.31 | 9.32 | 0.01 |
| May | 10.60 | 10.39 | -0.21 |
| Jun | 11.56 | 10.99 | -0.56 |
| Jul | 10.91 | 10.60 | -0.31 |
| Aug | 11.10 | 10.14 | -0.95 |
| Sep | 9.77 | 10.02 | 0.25 |
| Oct | 9.20 | 8.96 | -0.25 |
| Nov | 7.70 | 7.59 | -0.11 |
| Dec | 6.46 | 6.35 | -0.11 |
| ⌀ Month | 9.01 | 8.87 | -0.14 |
Rain (mm)
| Month | ⌀ 1940 - 1950 | ⌀ 2013 - 2023 | +/- |
|---|---|---|---|
| Jan | 4.54 | 3.73 | -0.81 |
| Feb | 4.47 | 4.56 | 0.09 |
| Mar | 5.29 | 3.87 | -1.42 |
| Apr | 4.58 | 5.02 | 0.44 |
| May | 3.38 | 4.21 | 0.83 |
| Jun | 3.35 | 4.40 | 1.05 |
| Jul | 3.89 | 4.44 | 0.56 |
| Aug | 2.69 | 6.18 | 3.49 |
| Sep | 3.16 | 3.15 | -0.01 |
| Oct | 1.82 | 2.77 | 0.95 |
| Nov | 3.34 | 3.01 | -0.33 |
| Dec | 4.19 | 4.55 | 0.35 |
| ⌀ Month | 3.73 | 4.16 | 0.43 |
Snow (mm)
| Month | ⌀ 1940 - 1950 | ⌀ 2013 - 2023 | +/- |
|---|---|---|---|
| Jan | 0.03 | 0.01 | -0.02 |
| Feb | 0.00 | 0.00 | 0.00 |
| Mar | 0.00 | 0.00 | 0.00 |
| Apr | 0.00 | 0.00 | 0.00 |
| May | 0.00 | 0.00 | 0.00 |
| Jun | 0.00 | 0.00 | 0.00 |
| Jul | 0.00 | 0.00 | 0.00 |
| Aug | 0.00 | 0.00 | 0.00 |
| Sep | 0.00 | 0.00 | 0.00 |
| Oct | 0.00 | 0.00 | 0.00 |
| Nov | 0.00 | 0.00 | 0.00 |
| Dec | 0.00 | 0.01 | 0.01 |
| ⌀ Month | 0.00 | 0.00 | -0.00 |