Climate Chart of Zapopan, Mexico
Comprehensive Climate Chart of Zapopan, Mexico: Monthly Averages and Weather Trends
Discover the climate and weather of Zapopan, Mexico
Zapopan, located in the state of Jalisco, Mexico, experiences a subtropical highland climate with dry winters and rainy summers. The average temperature ranges from 15°C to 25°C throughout the year. The rainy season typically lasts from June to September, with July being the wettest month. The city enjoys plenty of sunshine, making it a pleasant destination for outdoor activities.
Best Travel Time Guide for Zapopan, Mexico: Ideal Seasons and Weather Insights
The best time to travel to Zapopan is during the dry season from November to April when the weather is pleasant for exploring the city and its surroundings. The months of December to February offer cooler temperatures, making it ideal for outdoor activities.
Climate Data Overview for Zapopan, Mexico
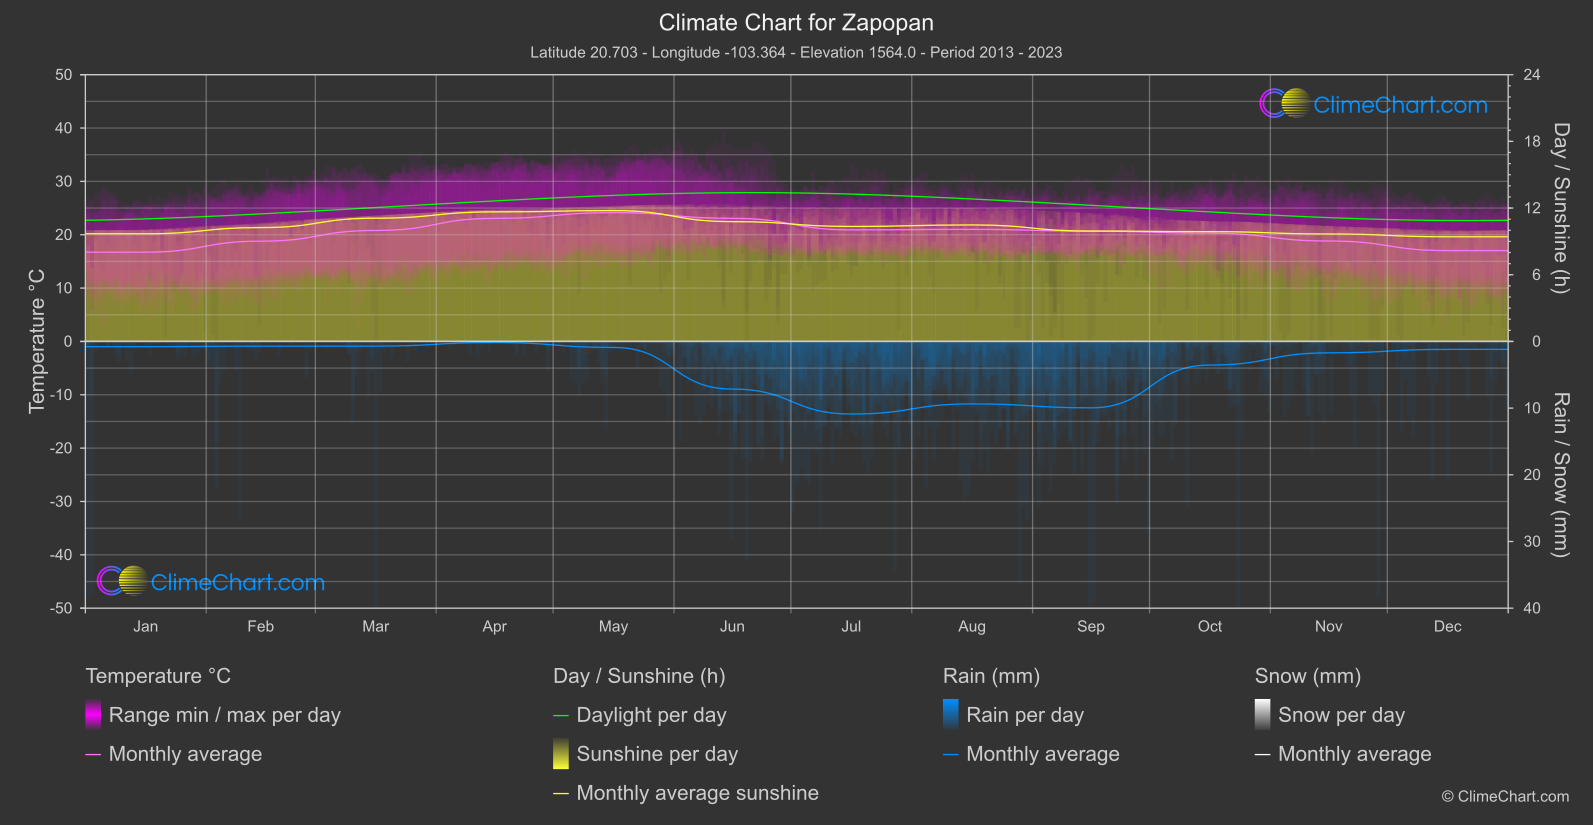
Explore the comprehensive climate data for Zapopan, Mexico. This detailed table provides valuable insights into temperature variations, precipitation levels, and seasonal changes, helping you understand the unique weather patterns of this region.
| Month | ⌀ Temperature °C | ⌀ Rain (mm) | ⌀ Snow (mm) | ⌀ Sunshine (h) |
|---|---|---|---|---|
| Jan | 16.7 | 0.39 | 0.00 | 9.69 |
| Feb | 18.8 | 0.36 | 0.00 | 10.24 |
| Mar | 20.8 | 0.35 | 0.00 | 11.09 |
| Apr | 23.1 | 0.08 | 0.00 | 11.66 |
| May | 24.1 | 0.45 | 0.00 | 11.77 |
| Jun | 23.1 | 3.57 | 0.00 | 10.78 |
| Jul | 20.9 | 5.44 | 0.00 | 10.35 |
| Aug | 21.0 | 4.68 | 0.00 | 10.48 |
| Sep | 20.7 | 4.98 | 0.00 | 9.93 |
| Oct | 20.3 | 1.77 | 0.00 | 9.88 |
| Nov | 18.8 | 0.86 | 0.00 | 9.67 |
| Dec | 17.0 | 0.60 | 0.00 | 9.42 |
| ⌀ Month | 20.4 | 1.96 | 0.00 | 10.41 |