Climate Chart of Yamoussoukro, Côte d'Ivoire
Comprehensive Climate Chart of Yamoussoukro, Côte d'Ivoire: Monthly Averages and Weather Trends
Discover the climate of Yamoussoukro, Côte d'Ivoire and plan your trip accordingly.
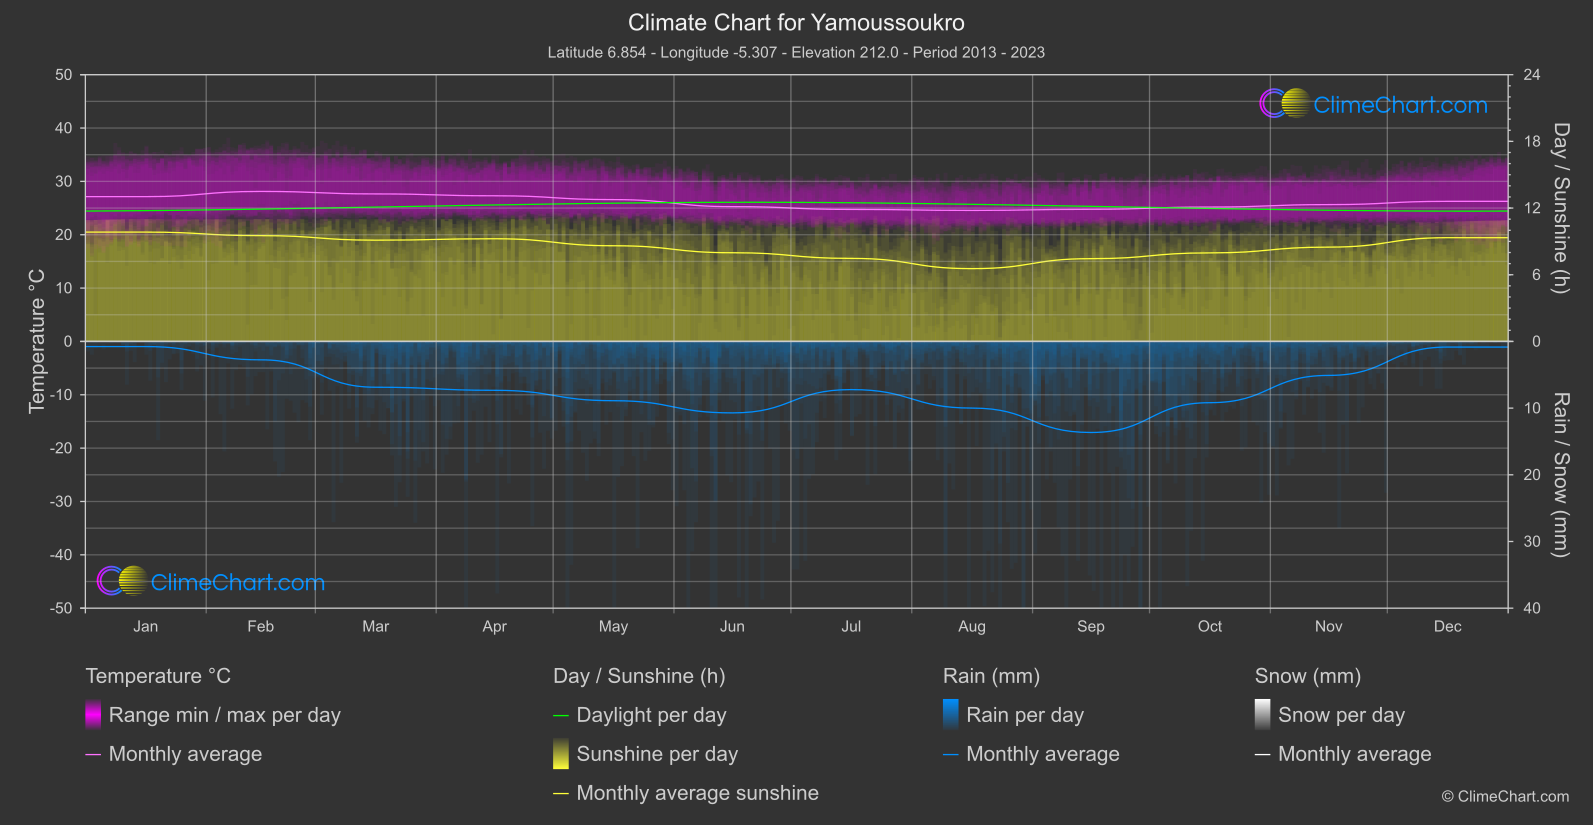
Yamoussoukro, the political capital of Côte d'Ivoire, has a tropical savanna climate. The city experiences a wet season from April to October and a dry season from November to March. Temperatures remain relatively constant throughout the year, with average highs ranging from 30°C to 33°C. Rainfall is highest in June and July, with occasional thunderstorms. Humidity levels are generally high, making the weather feel hotter than it is.
Best Travel Time Guide for Yamoussoukro, Côte d'Ivoire: Ideal Seasons and Weather Insights
The best time to visit Yamoussoukro is during the dry season from November to March when temperatures are more moderate and rainfall is minimal. This period offers ideal conditions for exploring the city's attractions and enjoying outdoor activities. Be prepared for high humidity levels throughout the year and pack light, breathable clothing.
Climate Data Overview for Yamoussoukro, Côte d'Ivoire
Explore the comprehensive climate data for Yamoussoukro, Côte d'Ivoire. This detailed table provides valuable insights into temperature variations, precipitation levels, and seasonal changes, helping you understand the unique weather patterns of this region.
| Month | ⌀ Temperature °C | ⌀ Rain (mm) | ⌀ Snow (mm) | ⌀ Sunshine (h) |
|---|---|---|---|---|
| Jan | 27.1 | 0.38 | 0.00 | 9.84 |
| Feb | 28.1 | 1.38 | 0.00 | 9.52 |
| Mar | 27.6 | 3.43 | 0.00 | 9.11 |
| Apr | 27.3 | 3.67 | 0.00 | 9.24 |
| May | 26.6 | 4.44 | 0.00 | 8.61 |
| Jun | 25.3 | 5.36 | 0.00 | 7.98 |
| Jul | 24.7 | 3.61 | 0.00 | 7.47 |
| Aug | 24.6 | 5.00 | 0.00 | 6.55 |
| Sep | 24.8 | 6.83 | 0.00 | 7.45 |
| Oct | 25.2 | 4.59 | 0.00 | 7.97 |
| Nov | 25.6 | 2.55 | 0.00 | 8.49 |
| Dec | 26.3 | 0.42 | 0.00 | 9.33 |
| ⌀ Month | 26.1 | 3.47 | 0.00 | 8.46 |