Climate Chart of Puerto Toro, Chile
Comprehensive Climate Chart of Puerto Toro, Chile: Monthly Averages and Weather Trends
Puerto Toro, Chile: Climate and Weather Overview
Puerto Toro is known for its maritime climate characterized by cool temperatures and high humidity. The region experiences rainfall throughout the year, with the wettest months typically from May to August. Fog is a common occurrence, especially in the mornings, due to the proximity to the sea. Summers are mild, with temperatures ranging from 5°C to 15°C, while winters can be cold with temperatures dropping to around 0°C. Travelers should be prepared for sudden weather changes and dress in layers to stay comfortable.
Best Travel Time Guide for Puerto Toro, Chile: Ideal Seasons and Weather Insights
The best time to visit Puerto Toro is during the summer months from December to February when the temperatures are milder and there is less rainfall. Travelers can enjoy outdoor activities and explore the stunning natural beauty of the region during this time. It is advisable to pack clothing suitable for both cool and warm weather due to the fluctuating temperatures. Spring and autumn also offer pleasant weather conditions for those looking to avoid the peak tourist season.
Climate Data Overview for Puerto Toro, Chile
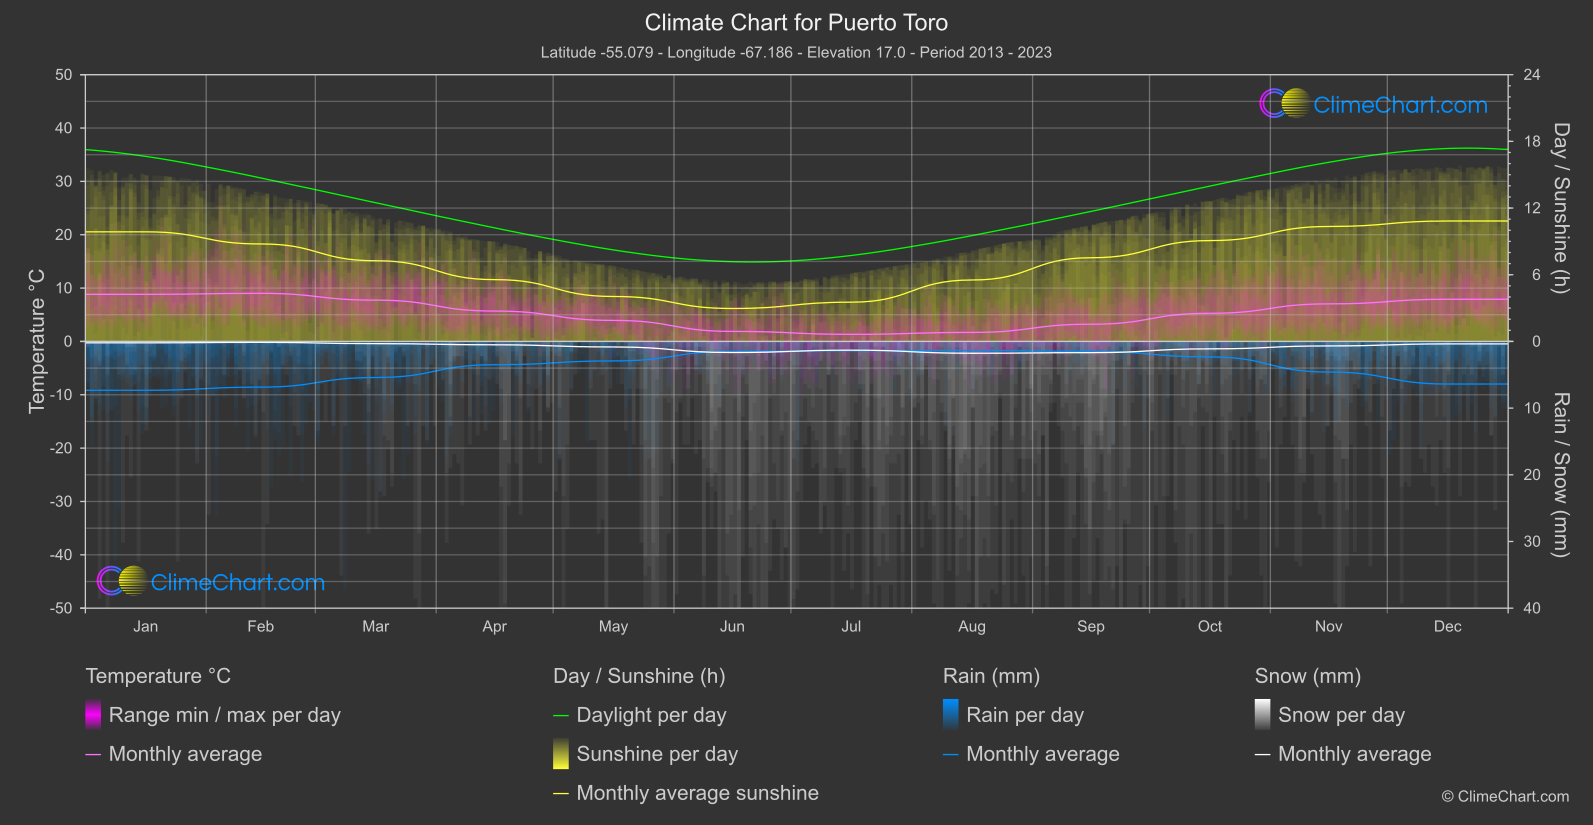
Explore the comprehensive climate data for Puerto Toro, Chile. This detailed table provides valuable insights into temperature variations, precipitation levels, and seasonal changes, helping you understand the unique weather patterns of this region.
| Month | ⌀ Temperature °C | ⌀ Rain (mm) | ⌀ Snow (mm) | ⌀ Sunshine (h) |
|---|---|---|---|---|
| Jan | 8.8 | 3.66 | 0.11 | 9.86 |
| Feb | 9.0 | 3.43 | 0.07 | 8.77 |
| Mar | 7.7 | 2.70 | 0.17 | 7.26 |
| Apr | 5.7 | 1.75 | 0.25 | 5.56 |
| May | 3.9 | 1.46 | 0.41 | 4.04 |
| Jun | 1.9 | 0.75 | 0.83 | 2.96 |
| Jul | 1.3 | 0.70 | 0.65 | 3.53 |
| Aug | 1.7 | 0.68 | 0.89 | 5.53 |
| Sep | 3.2 | 0.75 | 0.84 | 7.53 |
| Oct | 5.3 | 1.16 | 0.56 | 9.07 |
| Nov | 7.0 | 2.30 | 0.34 | 10.34 |
| Dec | 7.9 | 3.19 | 0.18 | 10.84 |
| ⌀ Month | 5.3 | 1.88 | 0.44 | 7.11 |