Climate Chart of Pattaya, Thailand
Comprehensive Climate Chart of Pattaya, Thailand: Monthly Averages and Weather Trends
Discover the Tropical Climate of Pattaya, Thailand
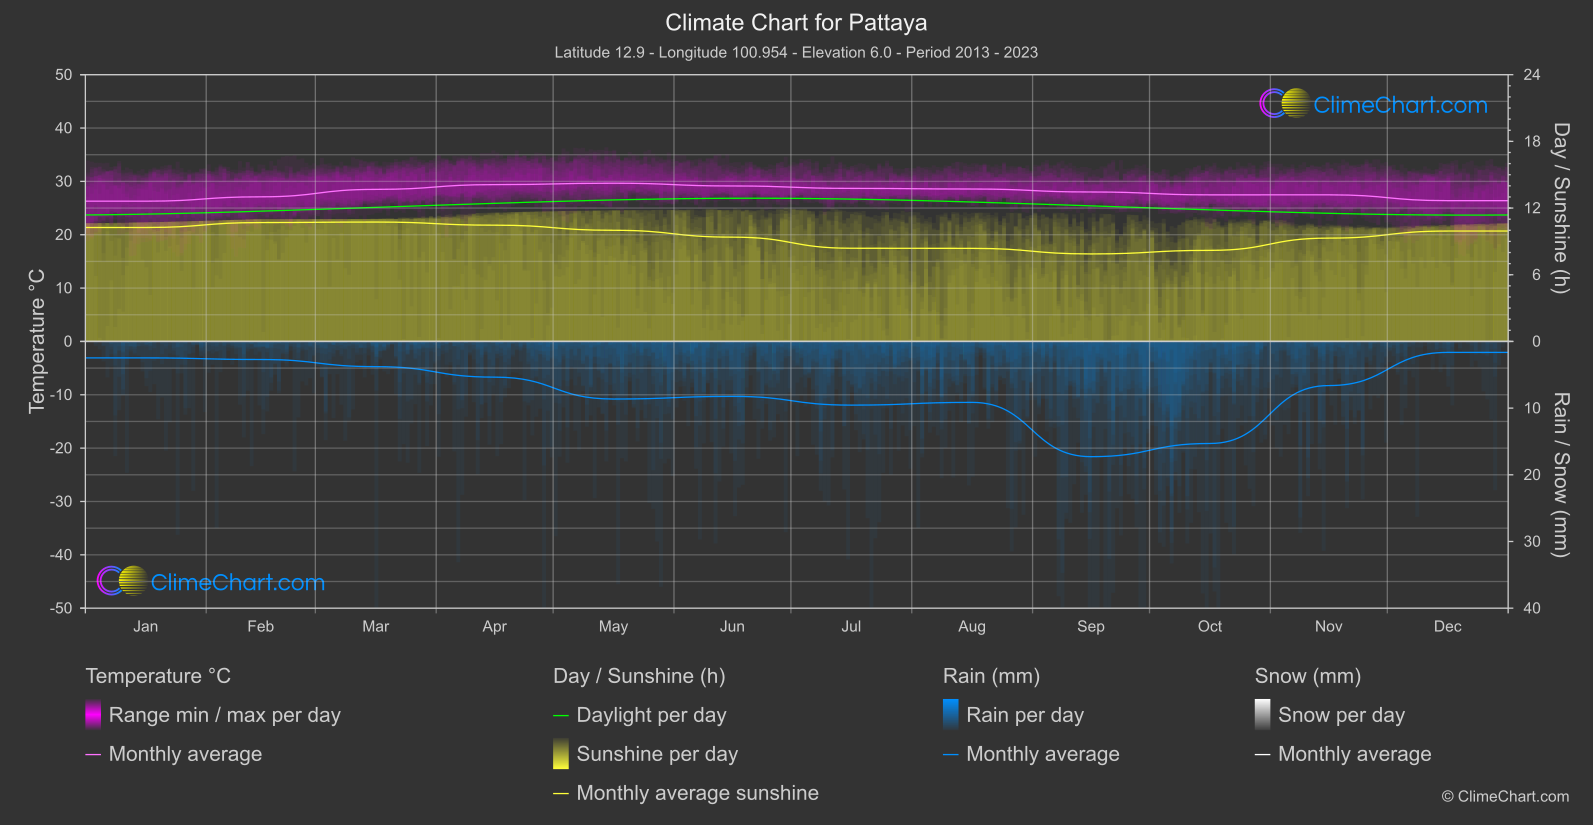
Pattaya, located on the eastern coast of Thailand, boasts a tropical monsoon climate. The city experiences two main seasons - a hot and humid season from March to September, and a cooler season from October to February. Rainfall is abundant, with the wettest months typically being September and October. The average annual temperature in Pattaya is around 28°C, making it an ideal destination for beachgoers and sun-seekers.
Best Travel Time Guide for Pattaya, Thailand: Ideal Seasons and Weather Insights
The best time to travel to Pattaya is during the cooler season from November to February when the weather is more pleasant and suitable for outdoor activities. However, if you prefer the bustling atmosphere of the hot and humid season, visiting between March and May could be ideal for you. Keep in mind that Pattaya can get crowded during peak tourist seasons, so plan your trip accordingly.
Climate Data Overview for Pattaya, Thailand
Explore the comprehensive climate data for Pattaya, Thailand. This detailed table provides valuable insights into temperature variations, precipitation levels, and seasonal changes, helping you understand the unique weather patterns of this region.
| Month | ⌀ Temperature °C | ⌀ Rain (mm) | ⌀ Snow (mm) | ⌀ Sunshine (h) |
|---|---|---|---|---|
| Jan | 26.3 | 1.23 | 0.00 | 10.25 |
| Feb | 27.1 | 1.35 | 0.00 | 10.70 |
| Mar | 28.5 | 1.89 | 0.00 | 10.74 |
| Apr | 29.4 | 2.68 | 0.00 | 10.46 |
| May | 29.7 | 4.32 | 0.00 | 10.00 |
| Jun | 29.1 | 4.12 | 0.00 | 9.38 |
| Jul | 28.7 | 4.78 | 0.00 | 8.38 |
| Aug | 28.6 | 4.57 | 0.00 | 8.37 |
| Sep | 28.0 | 8.64 | 0.00 | 7.87 |
| Oct | 27.5 | 7.65 | 0.00 | 8.19 |
| Nov | 27.5 | 3.31 | 0.00 | 9.30 |
| Dec | 26.4 | 0.82 | 0.00 | 9.93 |
| ⌀ Month | 28.1 | 3.78 | 0.00 | 9.46 |