Climate Chart of Maui (Hawaii), USA
Comprehensive Climate Chart of Maui (Hawaii), USA: Monthly Averages and Weather Trends
Discover the beautiful climate of Maui, Hawaii, United States of America.
Maui, Hawaii boasts a tropical climate with warm temperatures year-round. The average high temperatures range from 78°F (25°C) in winter to 88°F (31°C) in summer. The island experiences a dry season from April to October and a wet season from November to March, with occasional rain showers. Trade winds help moderate the temperature, making Maui a pleasant destination for outdoor activities.
Best Travel Time Guide for Maui (Hawaii), USA: Ideal Seasons and Weather Insights
The best time to visit Maui is during the dry season from April to October when you can enjoy sunny days and lower chances of rain. However, if you prefer fewer crowds and lower accommodation prices, consider traveling during the shoulder seasons of spring (April-May) or fall (September-October). Remember to pack sunscreen, light clothing, and a hat to protect yourself from the strong sun while exploring the stunning landscapes of Maui.
Climate Data Overview for Maui (Hawaii), USA
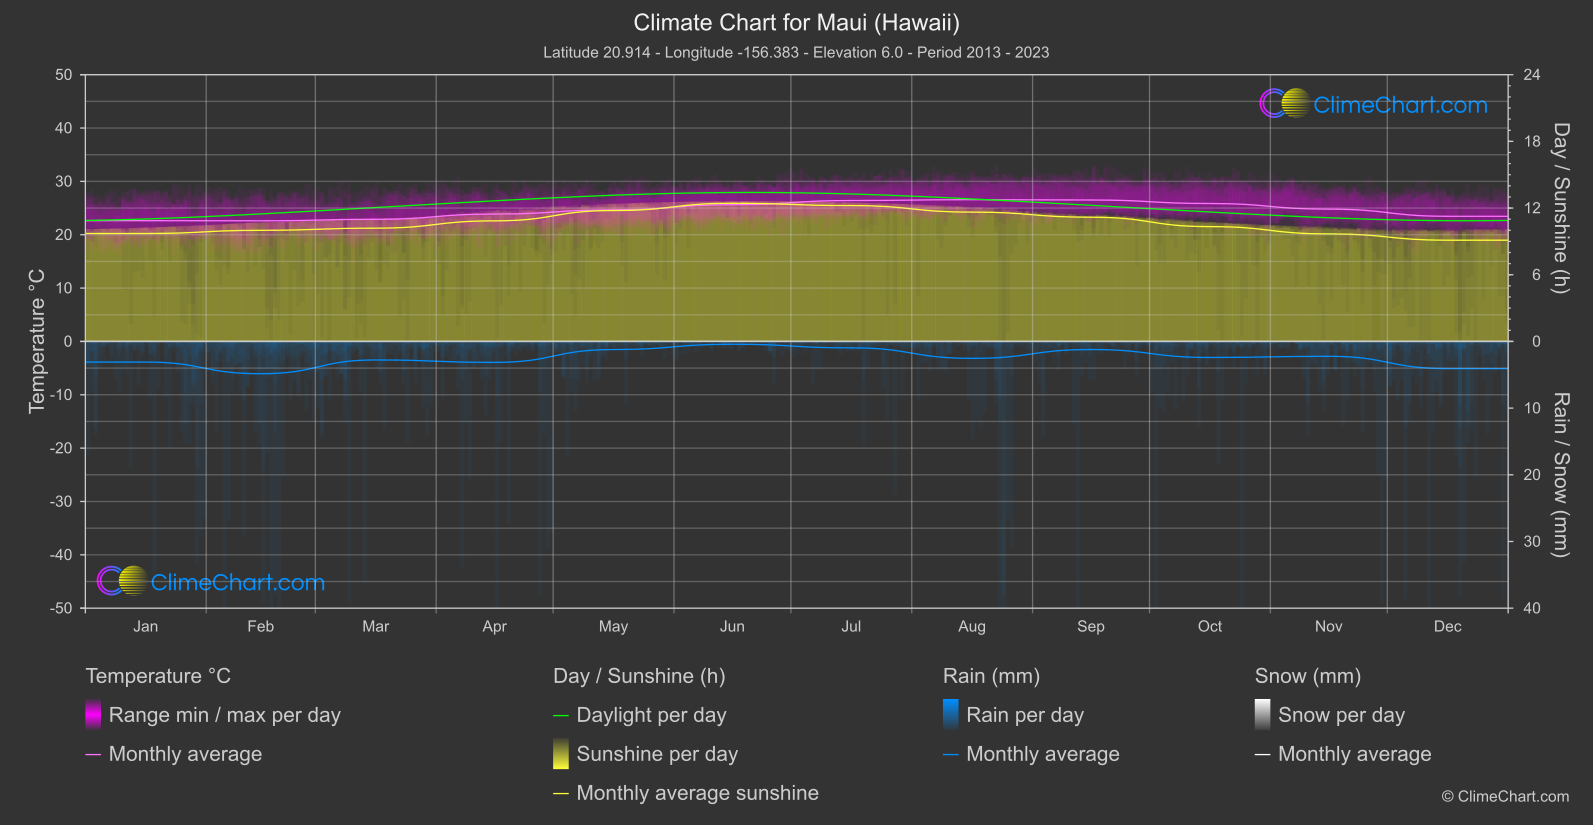
Explore the comprehensive climate data for Maui (Hawaii), USA. This detailed table provides valuable insights into temperature variations, precipitation levels, and seasonal changes, helping you understand the unique weather patterns of this region.
| Month | ⌀ Temperature °C | ⌀ Rain (mm) | ⌀ Snow (mm) | ⌀ Sunshine (h) |
|---|---|---|---|---|
| Jan | 22.6 | 1.55 | 0.00 | 9.71 |
| Feb | 22.6 | 2.42 | 0.00 | 10.00 |
| Mar | 22.9 | 1.39 | 0.00 | 10.19 |
| Apr | 23.9 | 1.57 | 0.00 | 10.85 |
| May | 24.7 | 0.61 | 0.00 | 11.78 |
| Jun | 25.6 | 0.21 | 0.00 | 12.43 |
| Jul | 26.4 | 0.48 | 0.00 | 12.22 |
| Aug | 26.6 | 1.27 | 0.00 | 11.63 |
| Sep | 26.5 | 0.61 | 0.00 | 11.18 |
| Oct | 25.9 | 1.20 | 0.00 | 10.33 |
| Nov | 24.8 | 1.12 | 0.00 | 9.67 |
| Dec | 23.5 | 2.04 | 0.00 | 9.11 |
| ⌀ Month | 24.7 | 1.21 | 0.00 | 10.76 |