Climate Chart of Maracaibo, Venezuela
Comprehensive Climate Chart of Maracaibo, Venezuela: Monthly Averages and Weather Trends
Explore the Climate of Maracaibo, Venezuela
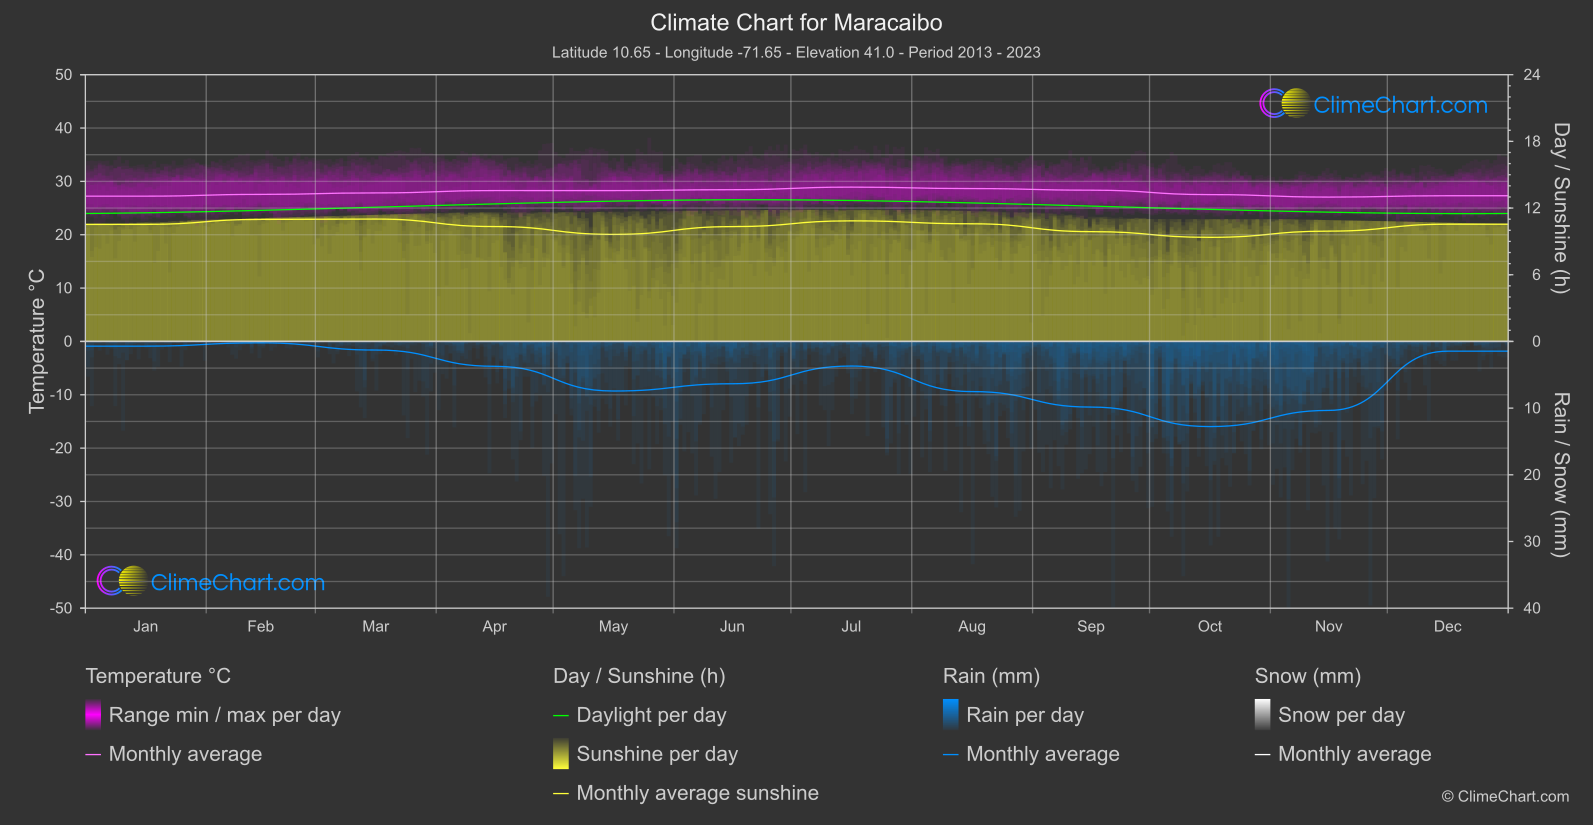
Maracaibo, located in Venezuela, boasts a tropical savanna climate characterized by high temperatures and distinct wet and dry seasons. The city experiences average temperatures ranging from 25°C to 30°C throughout the year. The dry season typically falls between December and April, while the wet season occurs from May to November, with June and July being the rainiest months. Due to its proximity to Lake Maracaibo, the city may experience occasional thunderstorms and high humidity levels.
Best Travel Time Guide for Maracaibo, Venezuela: Ideal Seasons and Weather Insights
The best time to travel to Maracaibo is during the dry season from December to April when you can enjoy sunny days and pleasant temperatures. However, if you don't mind occasional rain showers, visiting during the wet season from May to November can offer a unique experience of the city's lush greenery and vibrant atmosphere.
Climate Data Overview for Maracaibo, Venezuela
Explore the comprehensive climate data for Maracaibo, Venezuela. This detailed table provides valuable insights into temperature variations, precipitation levels, and seasonal changes, helping you understand the unique weather patterns of this region.
| Month | ⌀ Temperature °C | ⌀ Rain (mm) | ⌀ Snow (mm) | ⌀ Sunshine (h) |
|---|---|---|---|---|
| Jan | 27.2 | 0.35 | 0.00 | 10.53 |
| Feb | 27.6 | 0.11 | 0.00 | 10.98 |
| Mar | 27.8 | 0.64 | 0.00 | 11.01 |
| Apr | 28.3 | 1.86 | 0.00 | 10.34 |
| May | 28.3 | 3.72 | 0.00 | 9.63 |
| Jun | 28.4 | 3.17 | 0.00 | 10.33 |
| Jul | 28.9 | 1.85 | 0.00 | 10.85 |
| Aug | 28.7 | 3.76 | 0.00 | 10.58 |
| Sep | 28.4 | 4.92 | 0.00 | 9.88 |
| Oct | 27.5 | 6.38 | 0.00 | 9.37 |
| Nov | 27.1 | 5.17 | 0.00 | 9.92 |
| Dec | 27.3 | 0.73 | 0.00 | 10.55 |
| ⌀ Month | 28.0 | 2.72 | 0.00 | 10.33 |