Climate Chart of Malacca, Malaysia
Comprehensive Climate Chart of Malacca, Malaysia: Monthly Averages and Weather Trends
Malacca, Malaysia Climate Guide
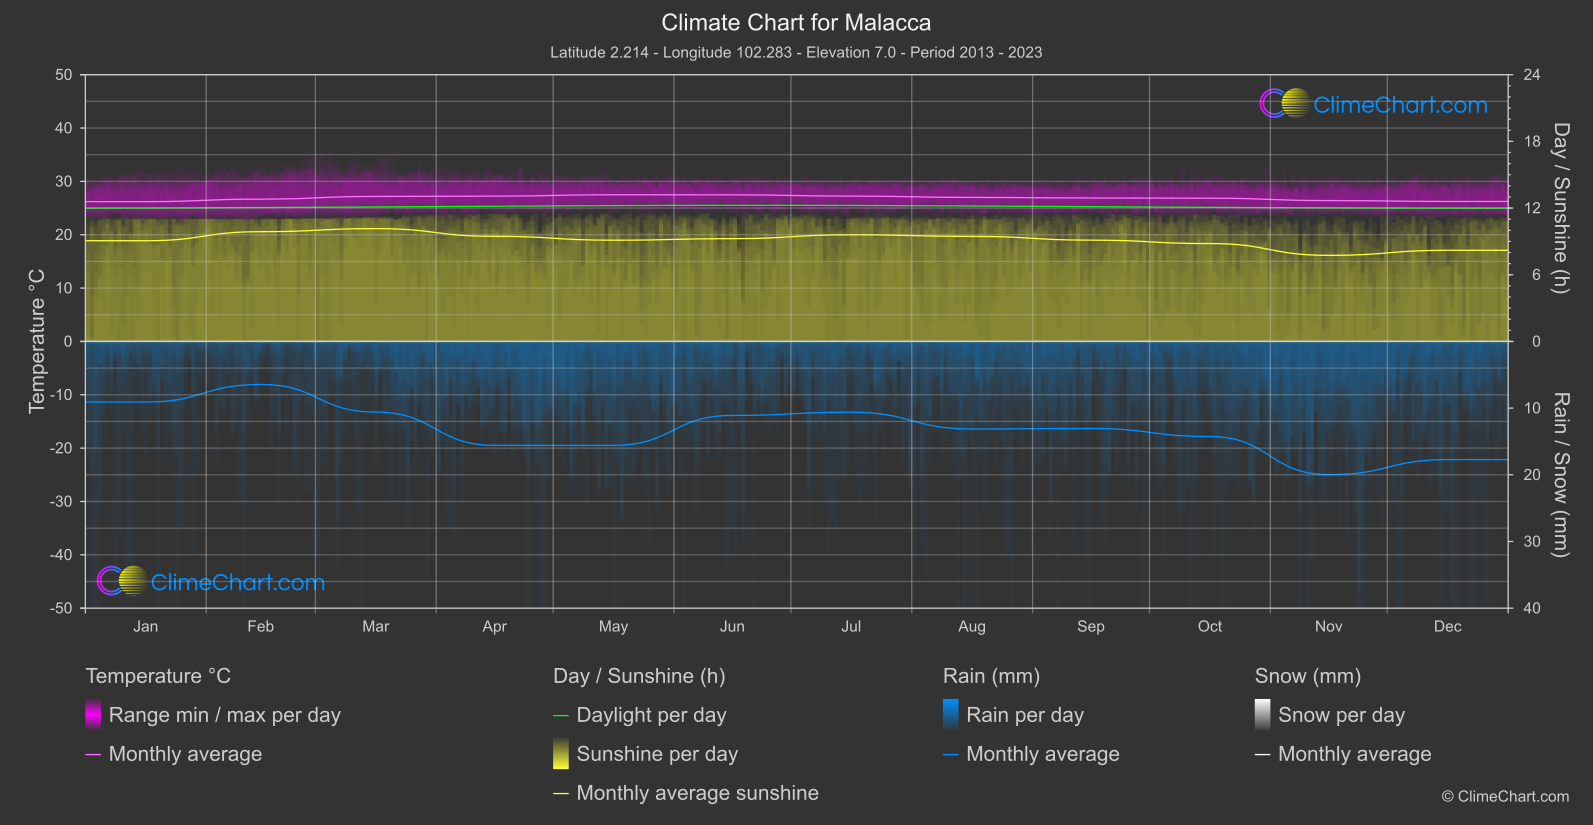
Malacca, a historical city in Malaysia, experiences a tropical rainforest climate. The weather is hot and humid throughout the year, with rainfall occurring evenly distributed. The wettest months are from September to November, while the period from May to August sees relatively drier weather.
Best Travel Time Guide for Malacca, Malaysia: Ideal Seasons and Weather Insights
The best time to visit Malacca is during the dry months from May to August when the weather is relatively cooler and more pleasant for outdoor activities and sightseeing.
Climate Data Overview for Malacca, Malaysia
Explore the comprehensive climate data for Malacca, Malaysia. This detailed table provides valuable insights into temperature variations, precipitation levels, and seasonal changes, helping you understand the unique weather patterns of this region.
| Month | ⌀ Temperature °C | ⌀ Rain (mm) | ⌀ Snow (mm) | ⌀ Sunshine (h) |
|---|---|---|---|---|
| Jan | 26.2 | 4.54 | 0.00 | 9.06 |
| Feb | 26.7 | 3.23 | 0.00 | 9.87 |
| Mar | 27.2 | 5.30 | 0.00 | 10.15 |
| Apr | 27.2 | 7.79 | 0.00 | 9.46 |
| May | 27.5 | 7.79 | 0.00 | 9.11 |
| Jun | 27.5 | 5.55 | 0.00 | 9.25 |
| Jul | 27.2 | 5.31 | 0.00 | 9.60 |
| Aug | 27.0 | 6.57 | 0.00 | 9.45 |
| Sep | 26.9 | 6.53 | 0.00 | 9.11 |
| Oct | 26.8 | 7.13 | 0.00 | 8.81 |
| Nov | 26.4 | 9.99 | 0.00 | 7.74 |
| Dec | 26.2 | 8.86 | 0.00 | 8.20 |
| ⌀ Month | 26.9 | 6.55 | 0.00 | 9.15 |