Climate Chart of Krabi, Thailand
Comprehensive Climate Chart of Krabi, Thailand: Monthly Averages and Weather Trends
Exploring the Climate of Krabi, Thailand
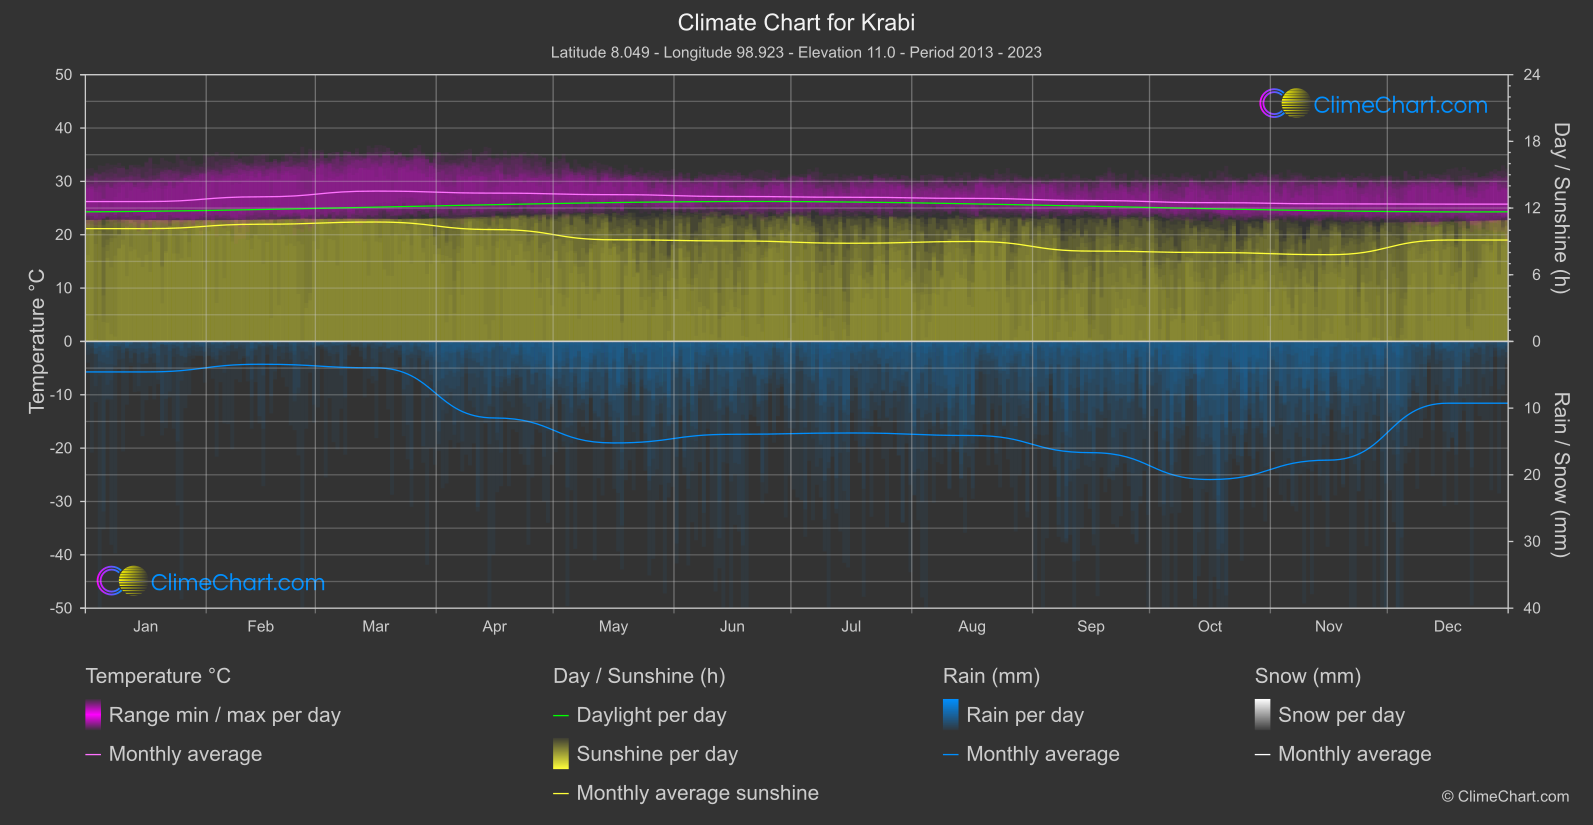
Krabi, located in southern Thailand, experiences a tropical monsoon climate with two distinct seasons: a wet season from May to November and a dry season from December to April. The average temperature ranges from 24°C to 32°C throughout the year, making it a popular destination for beach lovers and outdoor enthusiasts. The wet season brings heavy rainfall and high humidity, while the dry season offers sunny days and cooler evenings.
Best Travel Time Guide for Krabi, Thailand: Ideal Seasons and Weather Insights
The best time to travel to Krabi is during the dry season from December to April when the weather is sunny and pleasant for outdoor activities. This period is ideal for beach vacations, island hopping, and exploring the natural beauty of Krabi. Avoid visiting during the wet season if you want to enjoy the beaches and outdoor attractions to the fullest.
Climate Data Overview for Krabi, Thailand
Explore the comprehensive climate data for Krabi, Thailand. This detailed table provides valuable insights into temperature variations, precipitation levels, and seasonal changes, helping you understand the unique weather patterns of this region.
| Month | ⌀ Temperature °C | ⌀ Rain (mm) | ⌀ Snow (mm) | ⌀ Sunshine (h) |
|---|---|---|---|---|
| Jan | 26.2 | 2.29 | 0.00 | 10.15 |
| Feb | 27.1 | 1.71 | 0.00 | 10.55 |
| Mar | 28.2 | 1.98 | 0.00 | 10.74 |
| Apr | 27.8 | 5.74 | 0.00 | 10.06 |
| May | 27.5 | 7.61 | 0.00 | 9.14 |
| Jun | 27.2 | 6.96 | 0.00 | 9.04 |
| Jul | 27.0 | 6.86 | 0.00 | 8.83 |
| Aug | 26.8 | 7.05 | 0.00 | 8.99 |
| Sep | 26.4 | 8.34 | 0.00 | 8.13 |
| Oct | 26.0 | 10.35 | 0.00 | 8.00 |
| Nov | 25.8 | 8.90 | 0.00 | 7.80 |
| Dec | 25.7 | 4.63 | 0.00 | 9.12 |
| ⌀ Month | 26.8 | 6.04 | 0.00 | 9.21 |