Climate Chart of Ko Lipe, Thailand
Comprehensive Climate Chart of Ko Lipe, Thailand: Monthly Averages and Weather Trends
Welcome to Ko Lipe, Thailand! Discover the beautiful climate and weather of this tropical paradise.
Ko Lipe, located in the Andaman Sea, enjoys a tropical climate with high temperatures year-round. The island experiences a dry season from November to April, with clear skies and low humidity. The wet season occurs from May to October, bringing occasional rain showers and thunderstorms. The average temperature ranges from 28°C to 32°C, making it an ideal destination for beach lovers and water sports enthusiasts.
Best Travel Time Guide for Ko Lipe, Thailand: Ideal Seasons and Weather Insights
The best time to visit Ko Lipe is during the dry season from November to April when you can enjoy sunny days and clear skies. This period is perfect for beach activities and exploring the marine life. However, if you prefer fewer crowds and don't mind occasional rain showers, the wet season from May to October offers a more tranquil experience on the island.
Climate Data Overview for Ko Lipe, Thailand
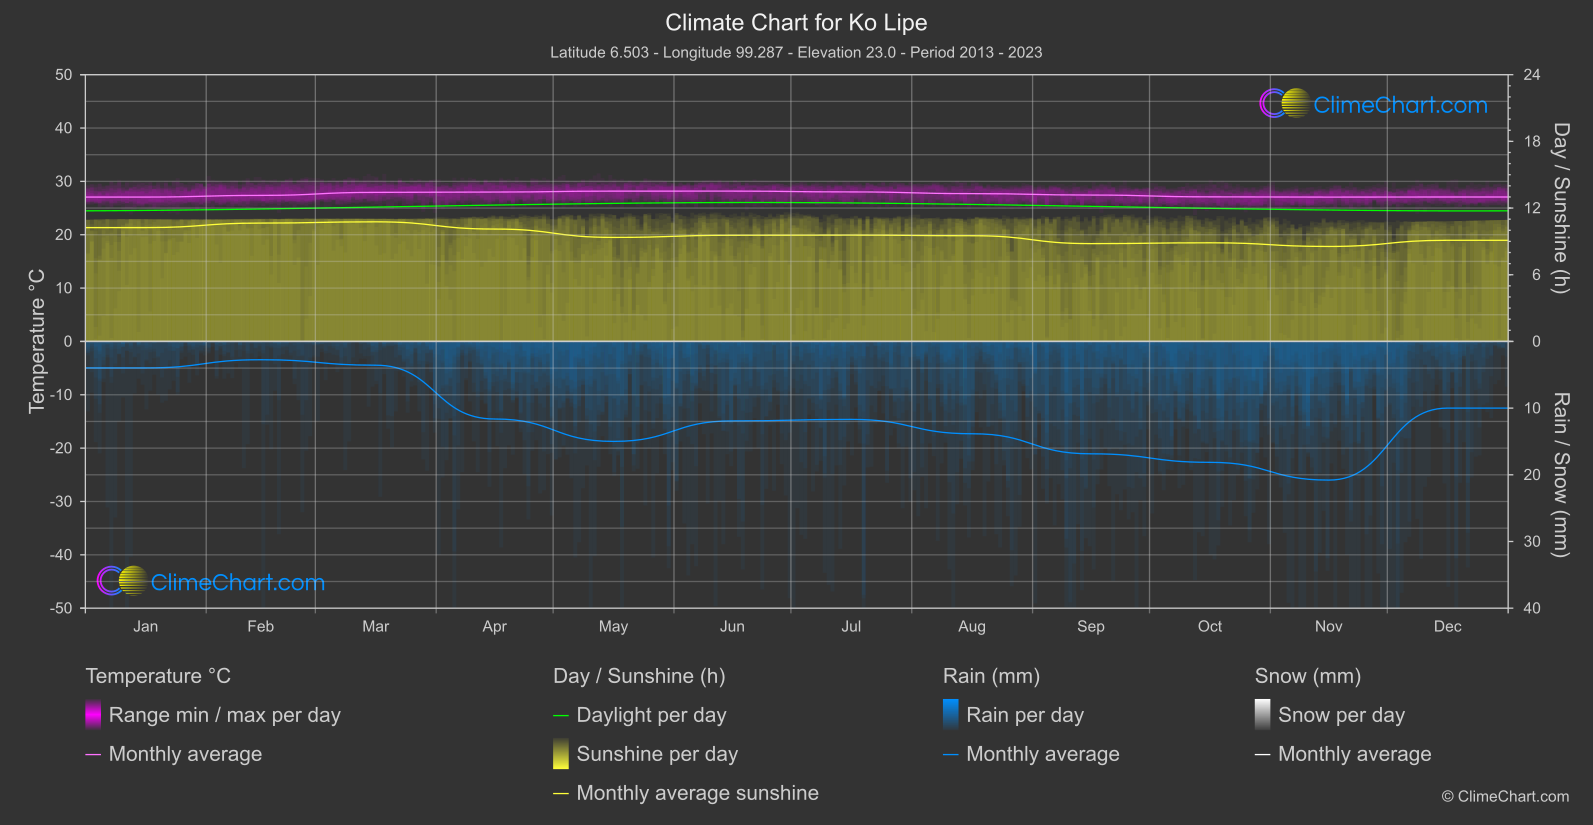
Explore the comprehensive climate data for Ko Lipe, Thailand. This detailed table provides valuable insights into temperature variations, precipitation levels, and seasonal changes, helping you understand the unique weather patterns of this region.
| Month | ⌀ Temperature °C | ⌀ Rain (mm) | ⌀ Snow (mm) | ⌀ Sunshine (h) |
|---|---|---|---|---|
| Jan | 27.1 | 1.99 | 0.00 | 10.24 |
| Feb | 27.4 | 1.37 | 0.00 | 10.65 |
| Mar | 27.9 | 1.78 | 0.00 | 10.76 |
| Apr | 28.0 | 5.82 | 0.00 | 10.11 |
| May | 28.2 | 7.50 | 0.00 | 9.36 |
| Jun | 28.2 | 5.96 | 0.00 | 9.55 |
| Jul | 28.0 | 5.85 | 0.00 | 9.57 |
| Aug | 27.7 | 6.92 | 0.00 | 9.51 |
| Sep | 27.4 | 8.43 | 0.00 | 8.80 |
| Oct | 27.1 | 9.07 | 0.00 | 8.87 |
| Nov | 27.1 | 10.40 | 0.00 | 8.55 |
| Dec | 27.1 | 5.00 | 0.00 | 9.10 |
| ⌀ Month | 27.6 | 5.84 | 0.00 | 9.59 |