Climate Chart of Giza, Egypt
Comprehensive Climate Chart of Giza, Egypt: Monthly Averages and Weather Trends
Discover the climate of Giza, Egypt
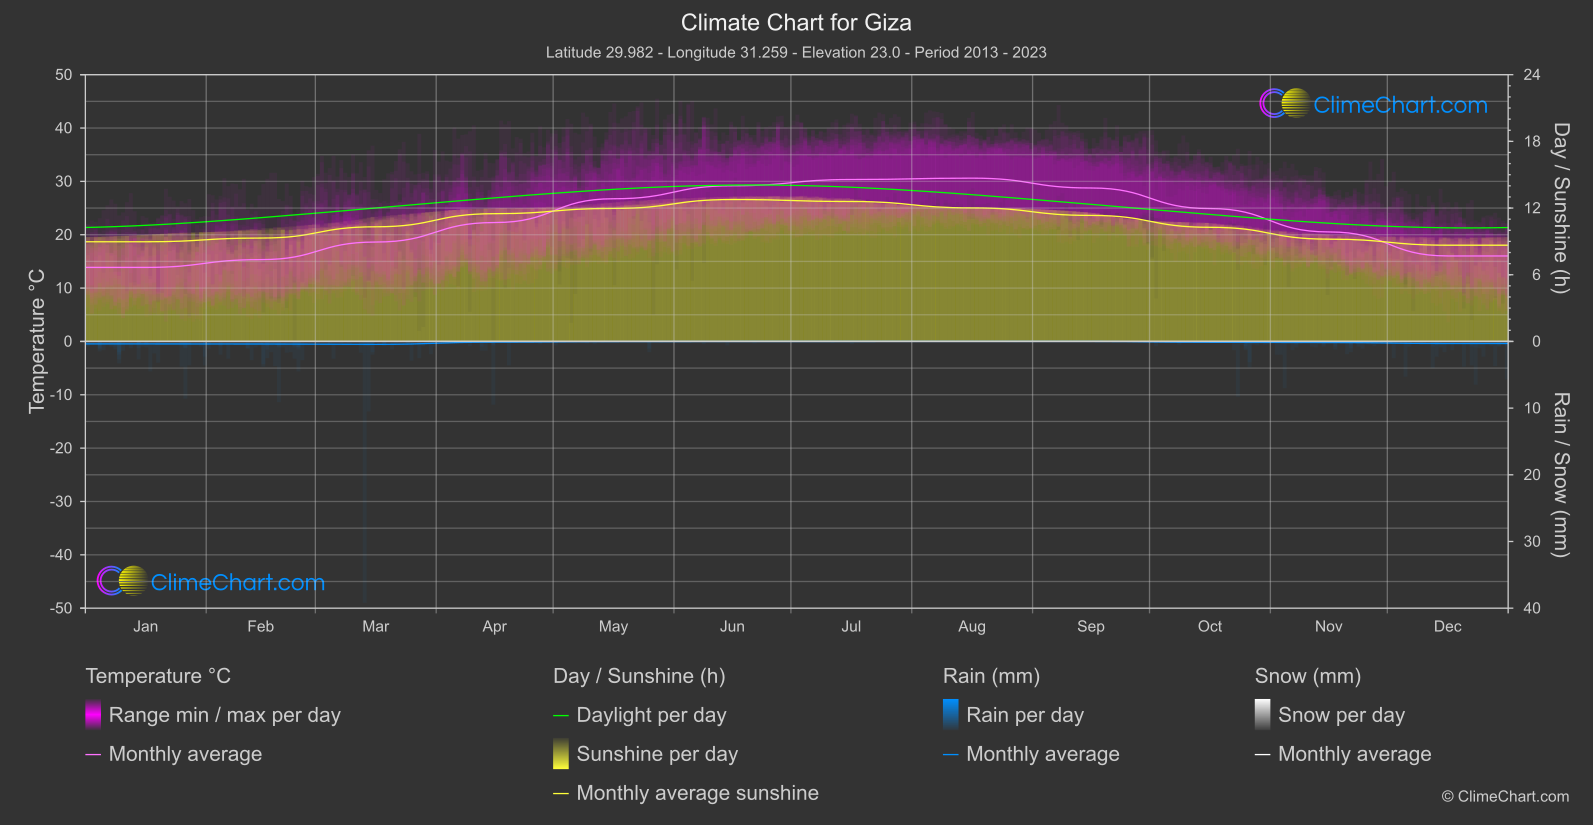
Giza, Egypt experiences a hot desert climate characterized by extremely hot summers and mild winters. The summer months, from June to August, can see temperatures soar above 40°C (104°F) with little to no rainfall. Winters, from December to February, are milder with daytime temperatures ranging between 18-24°C (64-75°F). Sandstorms are not uncommon in the region, especially during the transitional seasons of spring and autumn.
Best Travel Time Guide for Giza, Egypt: Ideal Seasons and Weather Insights
The best time to travel to Giza, Egypt is during the winter months from December to February when the weather is milder and more comfortable for exploring the ancient wonders of the region. Avoid visiting during the scorching summer months, especially in June to August, when extreme heat can make outdoor activities challenging.
Climate Data Overview for Giza, Egypt
Explore the comprehensive climate data for Giza, Egypt. This detailed table provides valuable insights into temperature variations, precipitation levels, and seasonal changes, helping you understand the unique weather patterns of this region.
| Month | ⌀ Temperature °C | ⌀ Rain (mm) | ⌀ Snow (mm) | ⌀ Sunshine (h) |
|---|---|---|---|---|
| Jan | 13.9 | 0.19 | 0.00 | 8.97 |
| Feb | 15.3 | 0.19 | 0.00 | 9.30 |
| Mar | 18.6 | 0.22 | 0.00 | 10.31 |
| Apr | 22.3 | 0.06 | 0.00 | 11.49 |
| May | 26.7 | 0.01 | 0.00 | 11.97 |
| Jun | 29.2 | 0.00 | 0.00 | 12.77 |
| Jul | 30.4 | 0.00 | 0.00 | 12.59 |
| Aug | 30.6 | 0.00 | 0.00 | 12.01 |
| Sep | 28.8 | 0.00 | 0.00 | 11.34 |
| Oct | 24.9 | 0.07 | 0.00 | 10.27 |
| Nov | 20.5 | 0.08 | 0.00 | 9.20 |
| Dec | 16.0 | 0.16 | 0.00 | 8.66 |
| ⌀ Month | 23.1 | 0.08 | 0.00 | 10.74 |