Climate Chart of Durban, South Africa
Comprehensive Climate Chart of Durban, South Africa: Monthly Averages and Weather Trends
Durban, South Africa Climate Overview
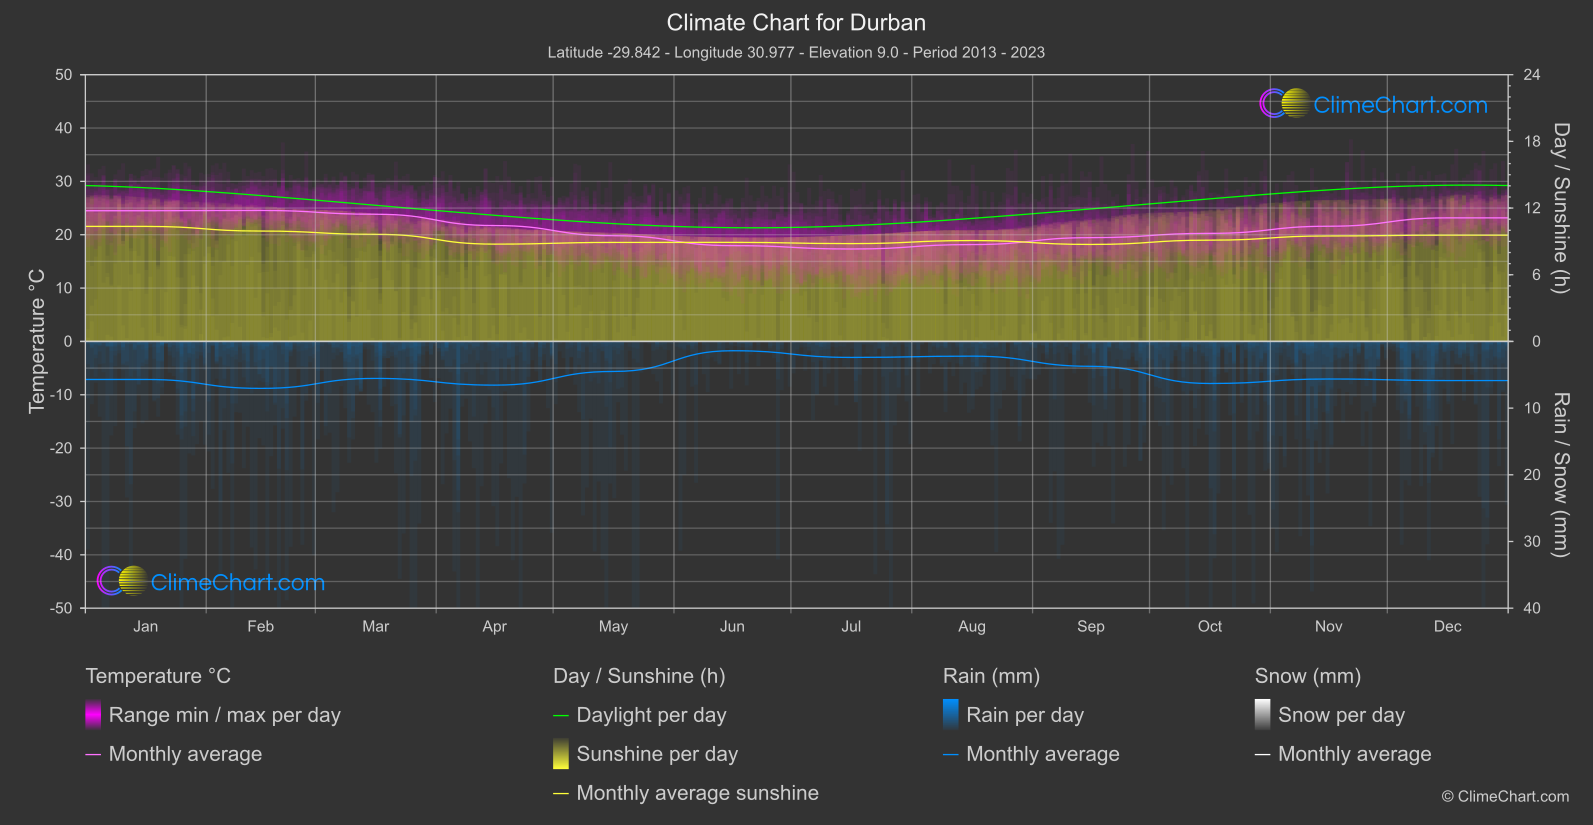
Durban, located on the east coast of South Africa, has a subtropical climate with hot and humid summers and mild, dry winters. The city experiences most of its rainfall during the summer months, while winters are generally dry. The average annual temperature in Durban is around 24°C (75°F). The coastal location of Durban also influences its climate, with sea breezes providing relief from the heat.
Best Travel Time Guide for Durban, South Africa: Ideal Seasons and Weather Insights
The best time to visit Durban is during the dry, mild winter months from May to August when the weather is pleasant and suitable for outdoor activities. Avoid the hot and humid summer months from November to February if you are sensitive to high temperatures. Durban's beaches and outdoor attractions are popular during the winter season.
Climate Data Overview for Durban, South Africa
Explore the comprehensive climate data for Durban, South Africa. This detailed table provides valuable insights into temperature variations, precipitation levels, and seasonal changes, helping you understand the unique weather patterns of this region.
| Month | ⌀ Temperature °C | ⌀ Rain (mm) | ⌀ Snow (mm) | ⌀ Sunshine (h) |
|---|---|---|---|---|
| Jan | 24.5 | 2.85 | 0.00 | 10.35 |
| Feb | 24.6 | 3.52 | 0.00 | 9.93 |
| Mar | 23.8 | 2.77 | 0.00 | 9.63 |
| Apr | 21.7 | 3.28 | 0.00 | 8.76 |
| May | 19.8 | 2.25 | 0.00 | 8.91 |
| Jun | 18.0 | 0.70 | 0.00 | 8.91 |
| Jul | 17.3 | 1.20 | 0.00 | 8.80 |
| Aug | 18.2 | 1.10 | 0.00 | 9.08 |
| Sep | 19.5 | 1.87 | 0.00 | 8.73 |
| Oct | 20.3 | 3.15 | 0.00 | 9.11 |
| Nov | 21.6 | 2.82 | 0.00 | 9.49 |
| Dec | 23.2 | 2.93 | 0.00 | 9.56 |
| ⌀ Month | 21.0 | 2.37 | 0.00 | 9.27 |