Climate Chart of Charleston, USA
Comprehensive Climate Chart of Charleston, USA: Monthly Averages and Weather Trends
Welcome to Charleston, USA! Discover the climate and weather patterns of this charming city.
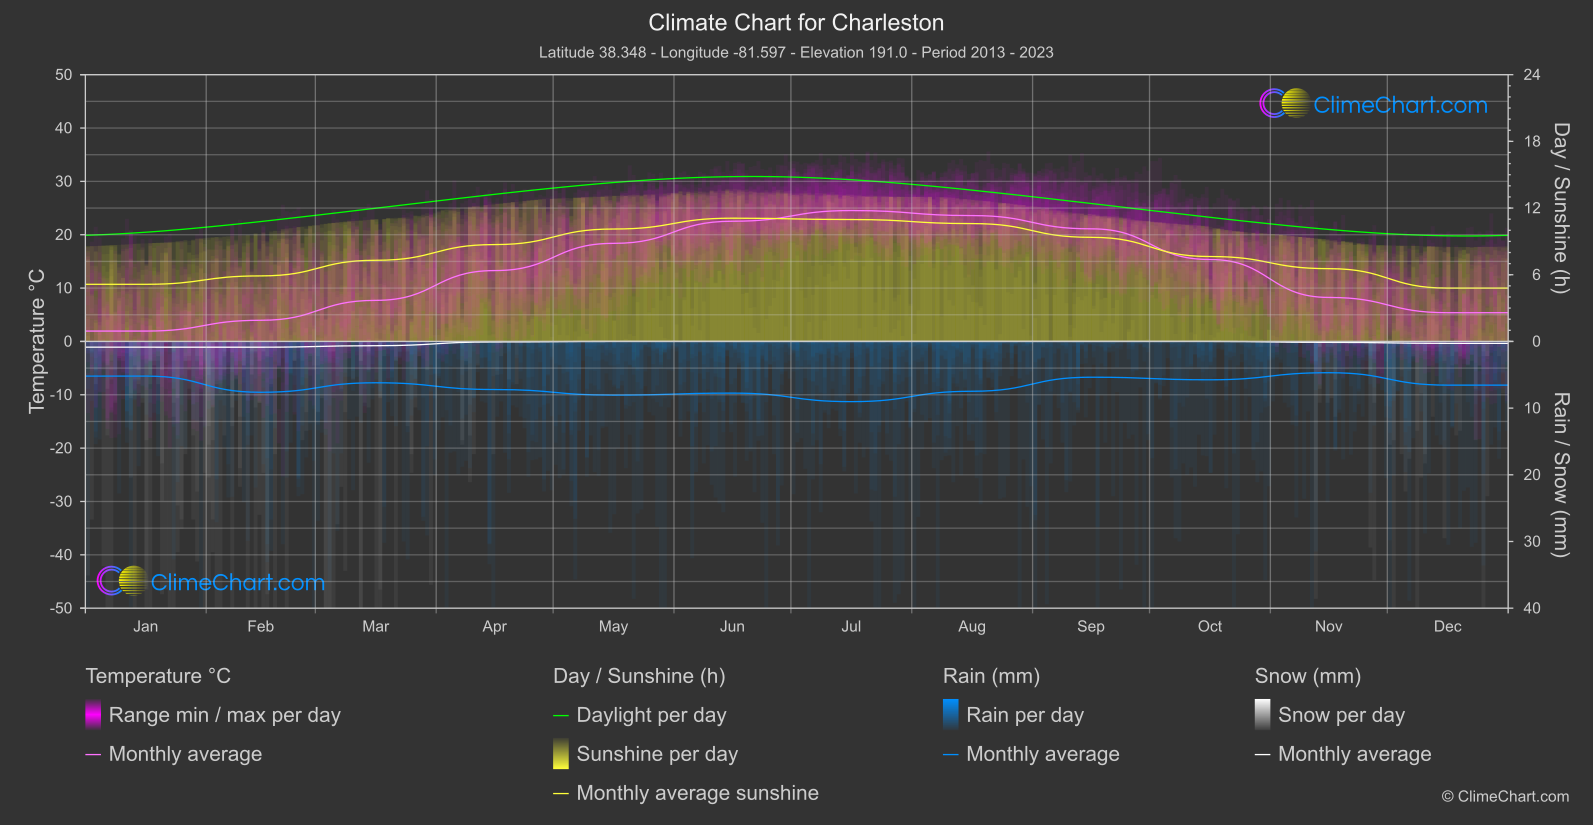
Charleston, USA, experiences a humid subtropical climate characterized by hot, humid summers and mild winters. The city receives ample rainfall throughout the year, with the wettest months typically being August and September. Visitors can expect plenty of sunshine during the summer months, while winter sees cooler temperatures but remains relatively mild compared to northern regions. Spring and fall offer pleasant weather with blooming flowers and colorful foliage.
Best Travel Time Guide for Charleston, USA: Ideal Seasons and Weather Insights
The best time to travel to Charleston is during the spring and fall when the weather is mild and pleasant. Summer offers plenty of sunshine but can be hot and humid, while winter is cooler but still enjoyable for sightseeing. Consider visiting in April or October for comfortable temperatures and fewer crowds.
Climate Data Overview for Charleston, USA
Explore the comprehensive climate data for Charleston, USA. This detailed table provides valuable insights into temperature variations, precipitation levels, and seasonal changes, helping you understand the unique weather patterns of this region.
| Month | ⌀ Temperature °C | ⌀ Rain (mm) | ⌀ Snow (mm) | ⌀ Sunshine (h) |
|---|---|---|---|---|
| Jan | 1.9 | 2.60 | 0.43 | 5.14 |
| Feb | 4.0 | 3.81 | 0.43 | 5.90 |
| Mar | 7.7 | 3.10 | 0.32 | 7.30 |
| Apr | 13.3 | 3.61 | 0.04 | 8.71 |
| May | 18.4 | 4.03 | 0.00 | 10.11 |
| Jun | 22.5 | 3.88 | 0.00 | 11.09 |
| Jul | 24.5 | 4.51 | 0.00 | 10.97 |
| Aug | 23.6 | 3.74 | 0.00 | 10.60 |
| Sep | 21.1 | 2.68 | 0.00 | 9.37 |
| Oct | 15.4 | 2.88 | 0.00 | 7.64 |
| Nov | 8.2 | 2.35 | 0.07 | 6.55 |
| Dec | 5.4 | 3.28 | 0.14 | 4.80 |
| ⌀ Month | 13.8 | 3.37 | 0.12 | 8.18 |