Climate Chart of Changwon, South Korea
Monthly data: Temperature °C, Rain (mm), Sunshine (h) · 2013–2023
Explore the Climate of Changwon, South Korea
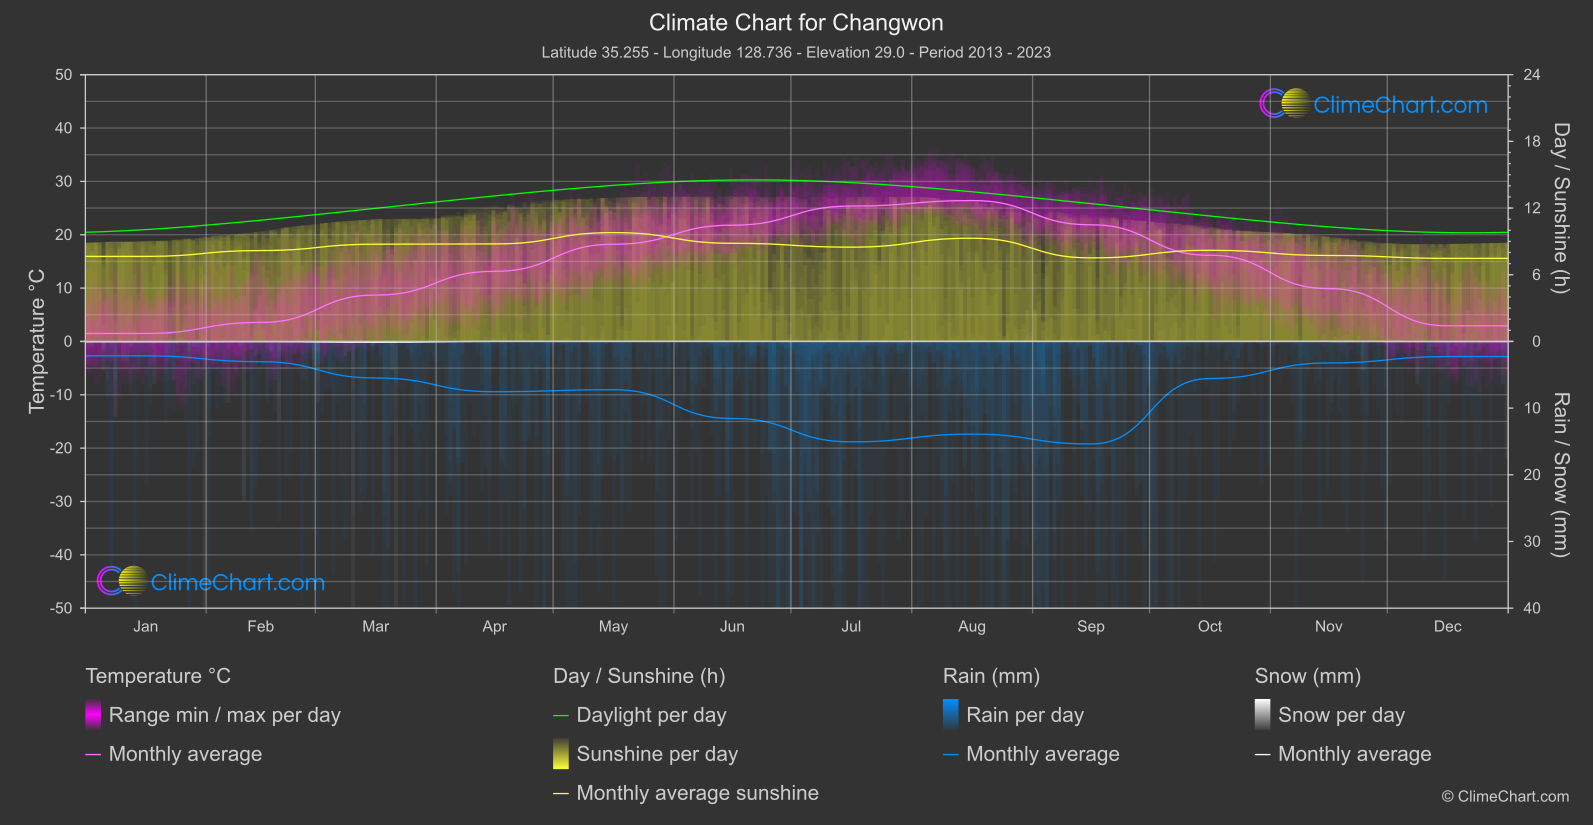
Climate overview
Temperature
Changwon, located in the southern part of South Korea, experiences a humid subtropical climate. Summers are hot and humid with temperatures averaging around 25-30°C, while winters are cold and dry with temperatures dropping to 0-5°C.
Rain
Changwon receives ample rainfall throughout the year, with the wettest months being July and August. Typhoons can also affect the region during the late summer months.
Best Travel Time Guide for Changwon, South Korea: Ideal Seasons and Weather Insights
The best time to travel to Changwon is during the spring (March to May) and autumn (September to November) when the weather is mild and pleasant. These seasons offer comfortable temperatures and colorful scenery due to cherry blossoms in spring and autumn foliage. Avoid visiting during the peak of summer (June to August) due to the high humidity and typhoon season.
Climate Data Overview for Changwon, South Korea
Explore the comprehensive climate data for Changwon, South Korea. This detailed table provides valuable insights into temperature variations, precipitation levels, and seasonal changes, helping you understand the unique weather patterns of this region.
| Month | Average: Temperature °C | Rain (mm) / day | Snow (mm) / day | Sunshine (h) / day |
|---|---|---|---|---|
| Jan | 1.5 | 1.08 | 0.30 | 7.65 |
| Feb | 3.6 | 1.52 | 0.17 | 8.18 |
| Mar | 8.7 | 2.74 | 0.62 | 8.75 |
| Apr | 13.1 | 3.77 | 0.00 | 8.77 |
| May | 18.2 | 3.62 | 0.00 | 9.79 |
| Jun | 21.8 | 5.78 | 0.00 | 8.83 |
| Jul | 25.4 | 7.53 | 0.00 | 8.48 |
| Aug | 26.4 | 6.95 | 0.00 | 9.29 |
| Sep | 21.9 | 7.69 | 0.00 | 7.52 |
| Oct | 16.2 | 2.78 | 0.00 | 8.20 |
| Nov | 9.9 | 1.61 | 0.01 | 7.73 |
| Dec | 2.9 | 1.14 | 0.13 | 7.47 |
| Average | 14.1 | 3.85 | 0.10 | 8.39 |