Climate Chart of Cancun, Mexico
Comprehensive Climate Chart of Cancun, Mexico: Monthly Averages and Weather Trends
Discover the Climate of Cancun, Mexico
Cancun, located in Mexico's Yucatán Peninsula, enjoys a tropical climate with consistently warm temperatures throughout the year. The city experiences distinct wet and dry seasons, with the wet season typically lasting from May to October. During this time, Cancun receives the majority of its annual rainfall, often in the form of short, intense showers. The dry season, from November to April, offers sunny days and lower humidity levels, making it a popular time for tourists to visit.
Best Travel Time Guide for Cancun, Mexico: Ideal Seasons and Weather Insights
The best time to visit Cancun is during the dry season from November to April when you can enjoy sunny days and pleasant weather. This period is ideal for beach activities, water sports, and exploring the Mayan ruins nearby. Avoid the wet season from May to October if you prefer to avoid heavy rainfall and humidity.
Climate Data Overview for Cancun, Mexico
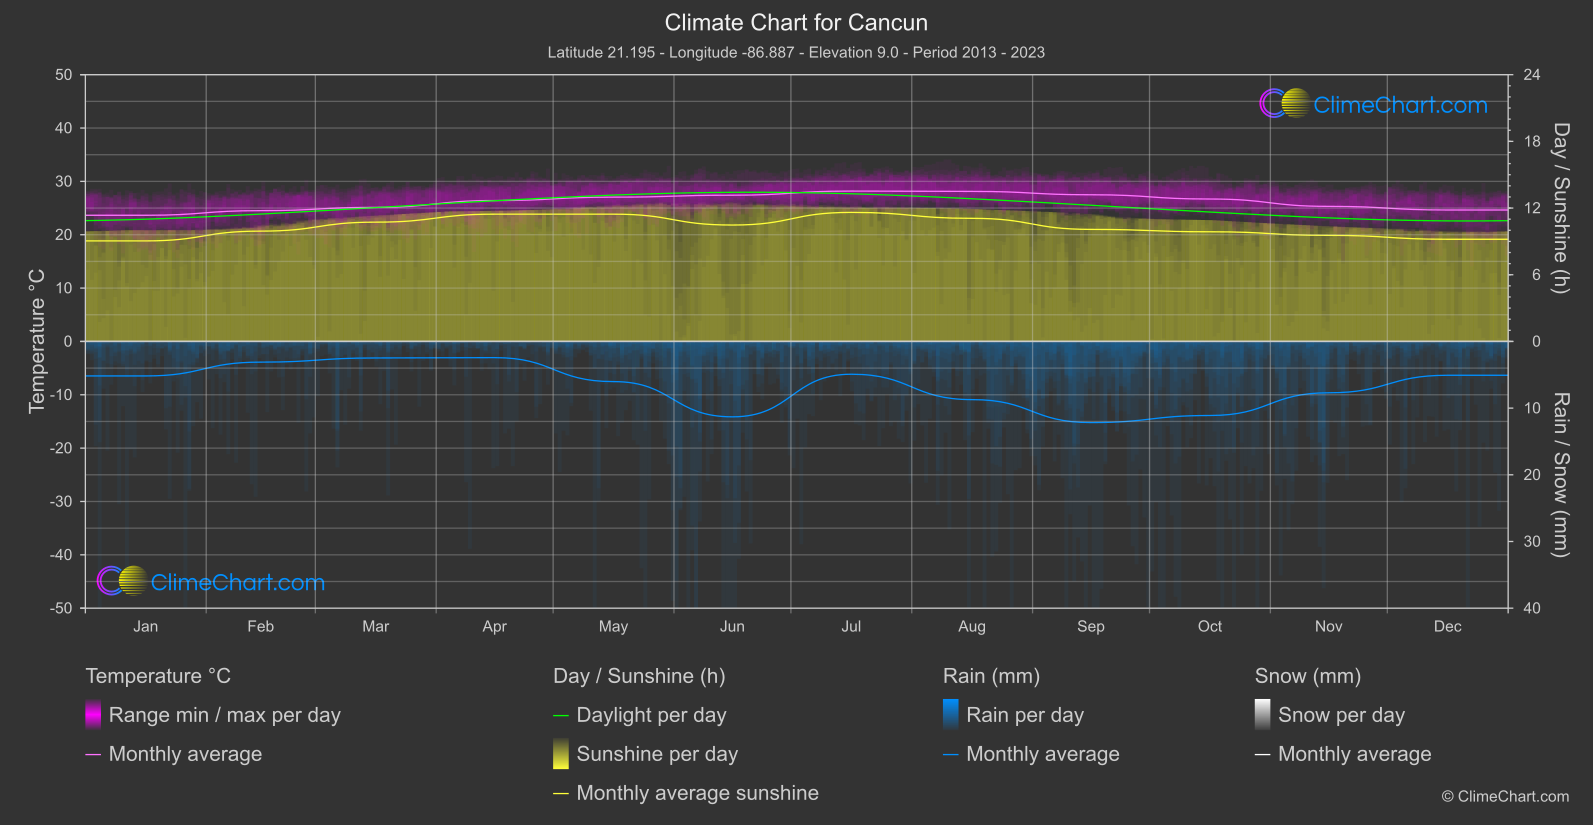
Explore the comprehensive climate data for Cancun, Mexico. This detailed table provides valuable insights into temperature variations, precipitation levels, and seasonal changes, helping you understand the unique weather patterns of this region.
| Month | ⌀ Temperature °C | ⌀ Rain (mm) | ⌀ Snow (mm) | ⌀ Sunshine (h) |
|---|---|---|---|---|
| Jan | 23.6 | 2.59 | 0.00 | 9.04 |
| Feb | 24.5 | 1.55 | 0.00 | 9.92 |
| Mar | 25.1 | 1.24 | 0.00 | 10.73 |
| Apr | 26.4 | 1.21 | 0.00 | 11.45 |
| May | 27.0 | 3.01 | 0.00 | 11.45 |
| Jun | 27.4 | 5.65 | 0.00 | 10.47 |
| Jul | 28.2 | 2.46 | 0.00 | 11.61 |
| Aug | 28.1 | 4.36 | 0.00 | 11.07 |
| Sep | 27.5 | 6.08 | 0.00 | 10.08 |
| Oct | 26.7 | 5.55 | 0.00 | 9.87 |
| Nov | 25.3 | 3.85 | 0.00 | 9.54 |
| Dec | 24.6 | 2.54 | 0.00 | 9.19 |
| ⌀ Month | 26.2 | 3.34 | 0.00 | 10.37 |