Climate Chart of Abu Dhabi, United Arab Emirates
Comprehensive Climate Chart of Abu Dhabi, United Arab Emirates: Monthly Averages and Weather Trends
Discover the climate of Abu Dhabi, United Arab Emirates.
Abu Dhabi, the capital of the United Arab Emirates, experiences a desert climate with scorching summers and mild winters. The city is characterized by hot and arid weather with very little rainfall throughout the year. Summers are extremely hot, with temperatures often exceeding 40°C (104°F), while winters are pleasantly warm, with temperatures ranging from 15°C to 25°C (59°F to 77°F). Sandstorms are common during the summer months, and humidity levels can be high, particularly along the coast.
Best Travel Time Guide for Abu Dhabi, United Arab Emirates: Ideal Seasons and Weather Insights
The best time to visit Abu Dhabi is during the winter months, from November to March, when the weather is most pleasant with mild temperatures and clear skies. This period offers ideal conditions for exploring the city's attractions and outdoor activities. Avoid visiting during the scorching summer months, especially from June to August, when the heat can be unbearable for many visitors.
Climate Data Overview for Abu Dhabi, United Arab Emirates
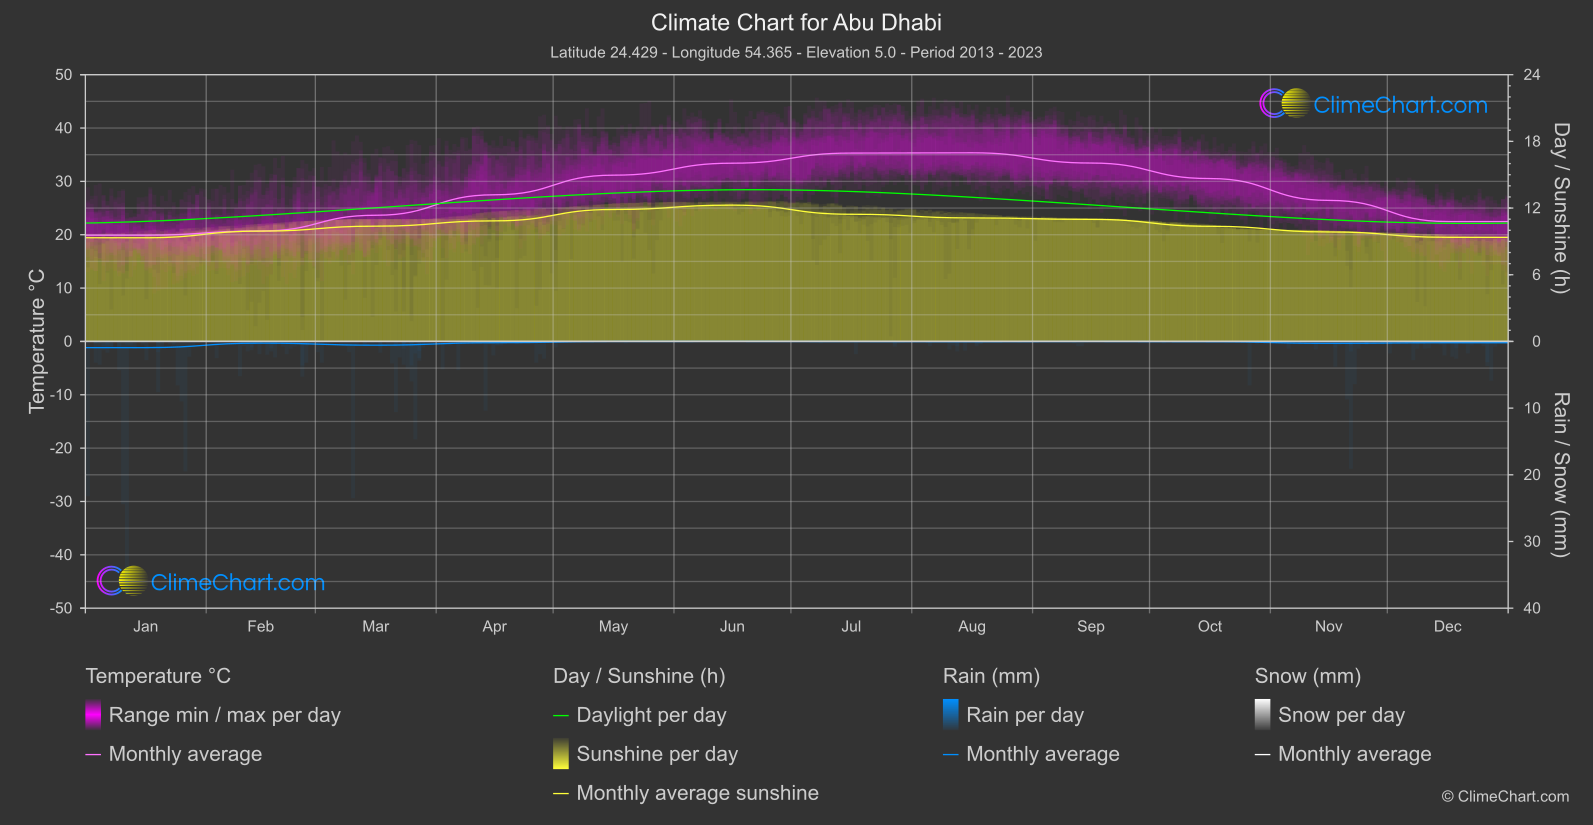
Explore the comprehensive climate data for Abu Dhabi, United Arab Emirates. This detailed table provides valuable insights into temperature variations, precipitation levels, and seasonal changes, helping you understand the unique weather patterns of this region.
| Month | ⌀ Temperature °C | ⌀ Rain (mm) | ⌀ Snow (mm) | ⌀ Sunshine (h) |
|---|---|---|---|---|
| Jan | 19.9 | 0.46 | 0.00 | 9.33 |
| Feb | 20.7 | 0.13 | 0.00 | 9.93 |
| Mar | 23.7 | 0.28 | 0.00 | 10.37 |
| Apr | 27.5 | 0.10 | 0.00 | 10.85 |
| May | 31.2 | 0.00 | 0.00 | 11.87 |
| Jun | 33.4 | 0.00 | 0.00 | 12.26 |
| Jul | 35.3 | 0.01 | 0.00 | 11.44 |
| Aug | 35.4 | 0.02 | 0.00 | 11.11 |
| Sep | 33.4 | 0.00 | 0.00 | 10.98 |
| Oct | 30.5 | 0.02 | 0.00 | 10.36 |
| Nov | 26.4 | 0.14 | 0.00 | 9.85 |
| Dec | 22.5 | 0.10 | 0.00 | 9.37 |
| ⌀ Month | 28.3 | 0.10 | 0.00 | 10.64 |