Climate Change Chart of Zurich, Switzerland
Comprehensive Climate Change Chart of Zurich, Switzerland: Monthly Averages and Impact Trends
Exploring the changing climate in Zurich, Switzerland
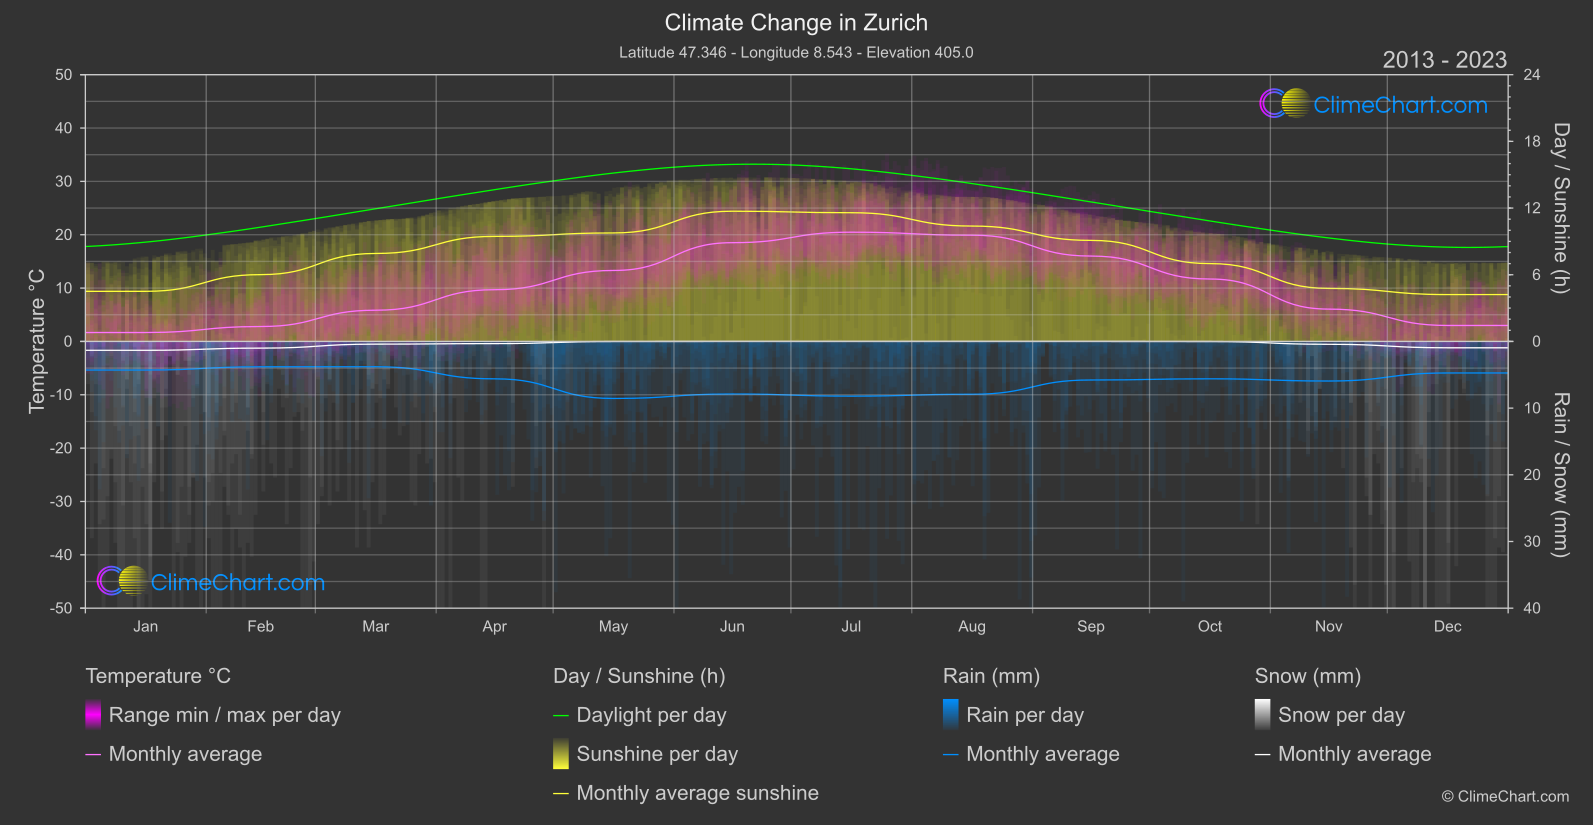
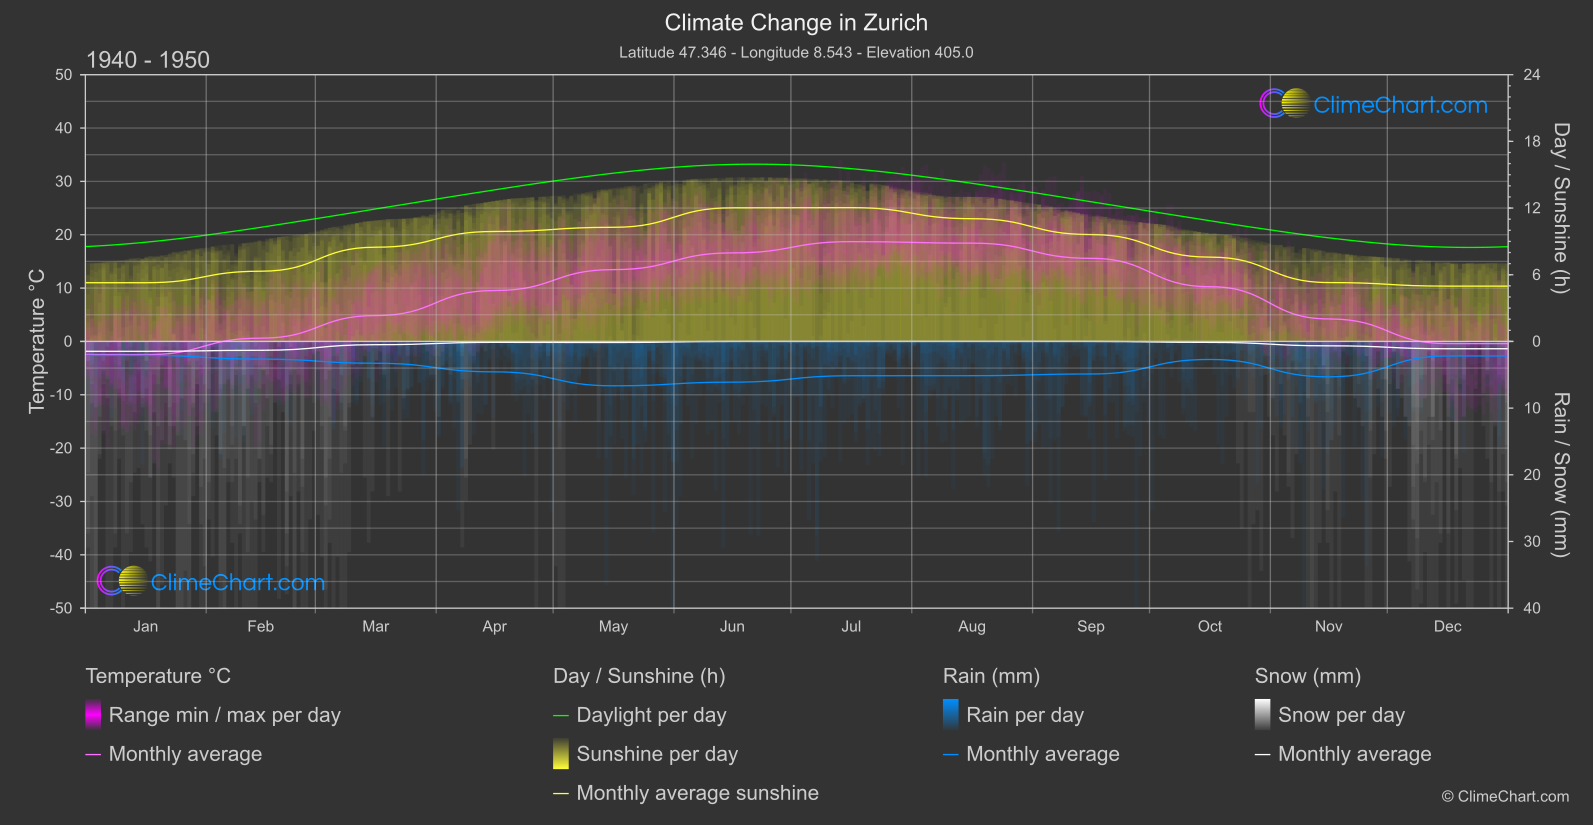
Zurich, Switzerland, has been experiencing notable changes in its climate over the years. Analyzing the temperature, rainfall, snowfall, and sunshine duration data from the periods of 1940-1950 and 2013-2024 reveals significant shifts. For instance, July has shown a temperature increase of 1.77°C, while December has experienced a temperature rise of 3.41°C. In terms of rainfall, October has seen a notable increase of 1.45mm. Snowfall has decreased in February by 0.16mm, and March has witnessed a reduction in sunshine duration by 0.56 hours.
Climate Change Data Overview for Zurich, Switzerland
Explore the comprehensive climate change data for Zurich, Switzerland. This detailed table provides valuable insights into temperature variations, precipitation levels, and seasonal changes influenced by climate change, helping you understand the unique weather patterns of this region.
Temperature °C
| Month | ⌀ 1940 - 1950 | ⌀ 2013 - 2023 | +/- |
|---|---|---|---|
| Jan | -2.49 | 1.67 | 4.16 |
| Feb | 0.62 | 2.80 | 2.18 |
| Mar | 4.85 | 5.85 | 1.00 |
| Apr | 9.54 | 9.70 | 0.16 |
| May | 13.46 | 13.30 | -0.16 |
| Jun | 16.59 | 18.51 | 1.92 |
| Jul | 18.71 | 20.48 | 1.77 |
| Aug | 18.42 | 19.91 | 1.49 |
| Sep | 15.58 | 16.00 | 0.43 |
| Oct | 10.26 | 11.70 | 1.44 |
| Nov | 4.22 | 6.06 | 1.84 |
| Dec | -0.42 | 2.99 | 3.41 |
| ⌀ Month | 9.11 | 10.75 | 1.64 |
Sunshine (h)
| Month | ⌀ 1940 - 1950 | ⌀ 2013 - 2023 | +/- |
|---|---|---|---|
| Jan | 5.28 | 4.51 | -0.77 |
| Feb | 6.32 | 6.01 | -0.31 |
| Mar | 8.48 | 7.91 | -0.56 |
| Apr | 9.89 | 9.45 | -0.44 |
| May | 10.27 | 9.76 | -0.51 |
| Jun | 12.02 | 11.72 | -0.31 |
| Jul | 12.04 | 11.58 | -0.46 |
| Aug | 11.04 | 10.38 | -0.66 |
| Sep | 9.62 | 9.09 | -0.53 |
| Oct | 7.59 | 7.00 | -0.58 |
| Nov | 5.30 | 4.77 | -0.53 |
| Dec | 4.98 | 4.22 | -0.76 |
| ⌀ Month | 8.57 | 8.03 | -0.53 |
Rain (mm)
| Month | ⌀ 1940 - 1950 | ⌀ 2013 - 2023 | +/- |
|---|---|---|---|
| Jan | 1.05 | 2.14 | 1.10 |
| Feb | 1.33 | 1.90 | 0.58 |
| Mar | 1.64 | 1.90 | 0.26 |
| Apr | 2.28 | 2.80 | 0.52 |
| May | 3.33 | 4.28 | 0.95 |
| Jun | 3.05 | 3.94 | 0.89 |
| Jul | 2.57 | 4.10 | 1.53 |
| Aug | 2.57 | 3.96 | 1.39 |
| Sep | 2.44 | 2.89 | 0.45 |
| Oct | 1.35 | 2.80 | 1.45 |
| Nov | 2.66 | 2.97 | 0.31 |
| Dec | 1.09 | 2.36 | 1.27 |
| ⌀ Month | 2.11 | 3.00 | 0.89 |
Snow (mm)
| Month | ⌀ 1940 - 1950 | ⌀ 2013 - 2023 | +/- |
|---|---|---|---|
| Jan | 0.74 | 0.67 | -0.07 |
| Feb | 0.66 | 0.50 | -0.16 |
| Mar | 0.24 | 0.20 | -0.04 |
| Apr | 0.07 | 0.16 | 0.09 |
| May | 0.08 | 0.01 | -0.08 |
| Jun | 0.00 | 0.00 | 0.00 |
| Jul | 0.00 | 0.00 | 0.00 |
| Aug | 0.00 | 0.00 | 0.00 |
| Sep | 0.00 | 0.00 | 0.00 |
| Oct | 0.07 | 0.01 | -0.06 |
| Nov | 0.33 | 0.21 | -0.11 |
| Dec | 0.55 | 0.48 | -0.07 |
| ⌀ Month | 0.23 | 0.19 | -0.04 |