Climate Change Chart of Zermatt, Switzerland
Comprehensive Climate Change Chart of Zermatt, Switzerland: Monthly Averages and Impact Trends
Exploring the changing climate in Zermatt, Switzerland
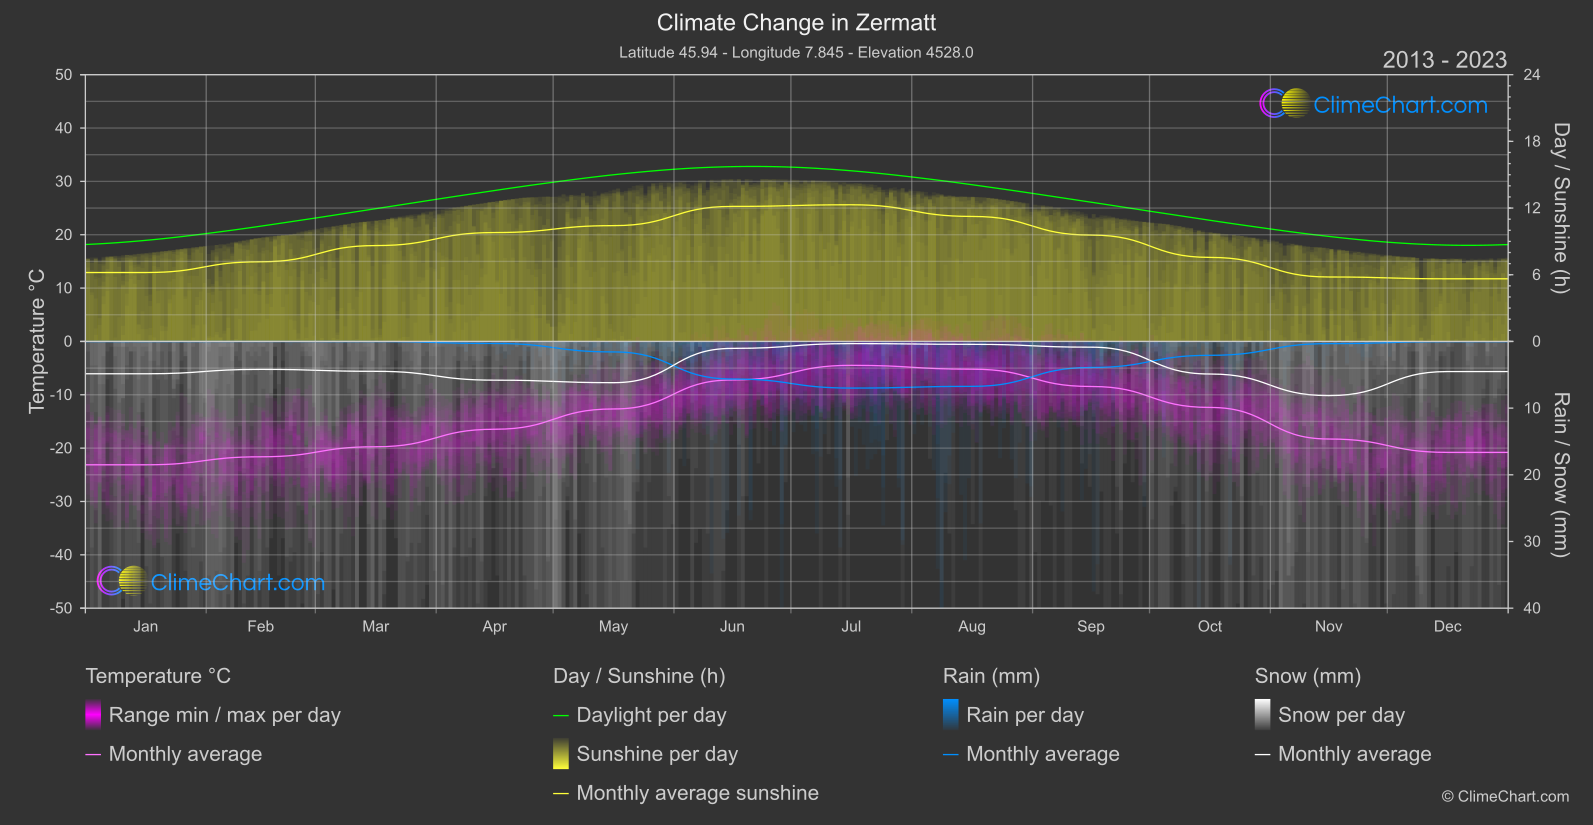
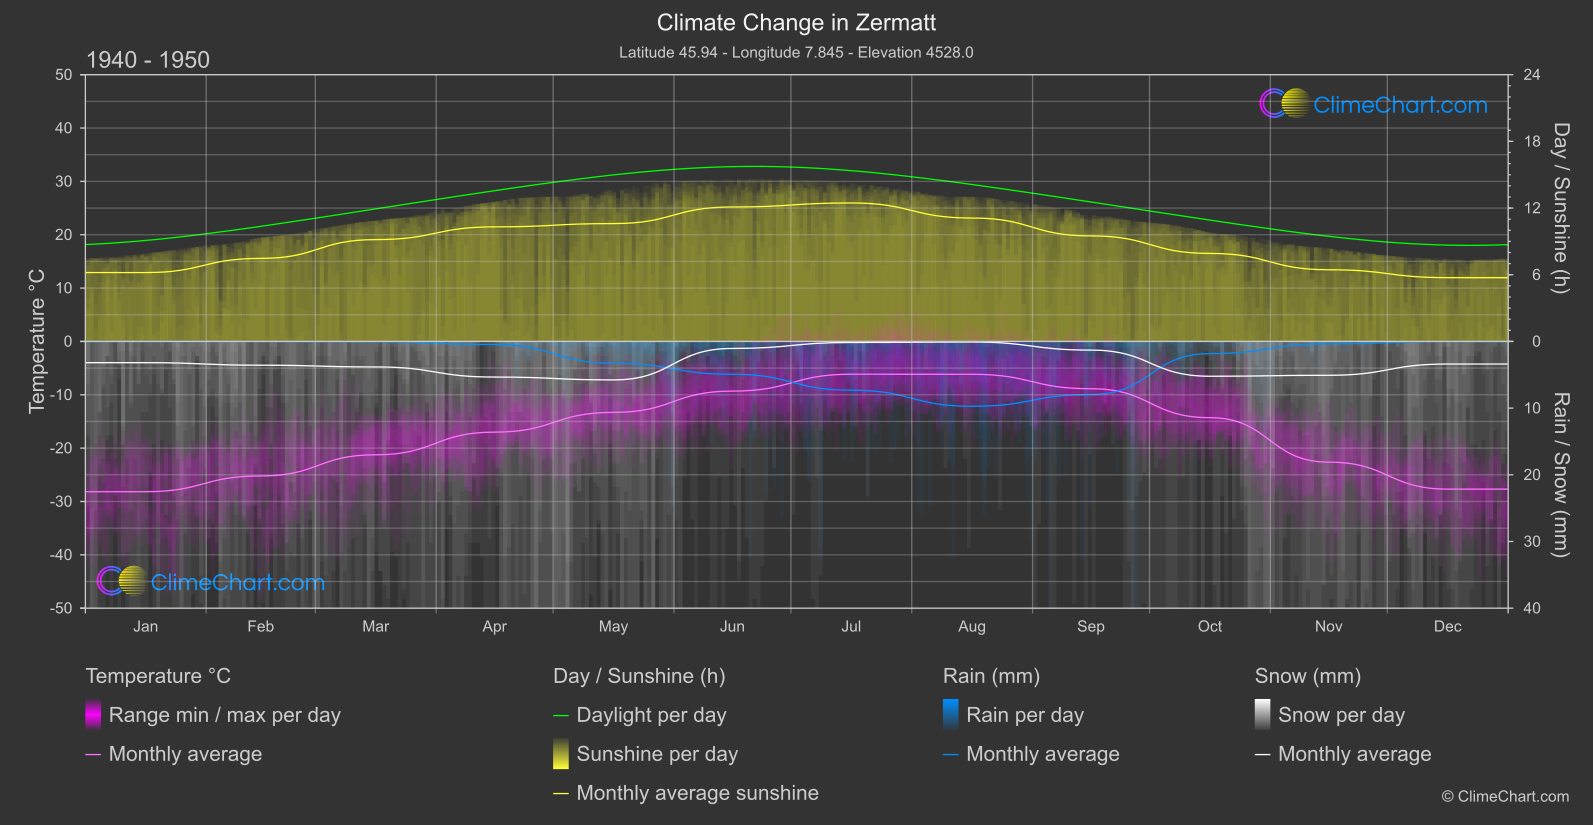
Zermatt, a picturesque town in Switzerland known for the iconic Matterhorn, has been experiencing notable shifts in climate parameters. Analyzing temperature, rainfall, snowfall, and sunshine duration data from 1940 to 1950 and comparing it to the period of 2013 to 2024 reveals interesting insights. For instance, December shows a significant increase in temperature of 6.89°C, indicating a warming trend. In terms of rainfall, May has seen a drastic reduction in precipitation by 0.85mm. Snowfall patterns have also evolved, with November witnessing a substantial increase of 1.52mm. Moreover, sunshine duration has slightly decreased across the months, with November experiencing the most significant drop of 0.65 hours.
Climate Change Data Overview for Zermatt, Switzerland
Explore the comprehensive climate change data for Zermatt, Switzerland. This detailed table provides valuable insights into temperature variations, precipitation levels, and seasonal changes influenced by climate change, helping you understand the unique weather patterns of this region.
Temperature °C
| Month | ⌀ 1940 - 1950 | ⌀ 2013 - 2023 | +/- |
|---|---|---|---|
| Jan | -28.16 | -23.12 | 5.04 |
| Feb | -25.22 | -21.62 | 3.59 |
| Mar | -21.25 | -19.74 | 1.50 |
| Apr | -17.00 | -16.46 | 0.54 |
| May | -13.30 | -12.66 | 0.64 |
| Jun | -9.31 | -7.22 | 2.09 |
| Jul | -6.15 | -4.48 | 1.67 |
| Aug | -6.16 | -5.20 | 0.96 |
| Sep | -8.87 | -8.44 | 0.42 |
| Oct | -14.29 | -12.37 | 1.92 |
| Nov | -22.63 | -18.29 | 4.34 |
| Dec | -27.69 | -20.80 | 6.89 |
| ⌀ Month | -16.67 | -14.20 | 2.47 |
Sunshine (h)
| Month | ⌀ 1940 - 1950 | ⌀ 2013 - 2023 | +/- |
|---|---|---|---|
| Jan | 6.20 | 6.20 | 0.00 |
| Feb | 7.47 | 7.17 | -0.30 |
| Mar | 9.16 | 8.62 | -0.54 |
| Apr | 10.31 | 9.80 | -0.51 |
| May | 10.60 | 10.42 | -0.18 |
| Jun | 12.10 | 12.15 | 0.05 |
| Jul | 12.46 | 12.30 | -0.16 |
| Aug | 11.10 | 11.25 | 0.14 |
| Sep | 9.49 | 9.57 | 0.08 |
| Oct | 7.92 | 7.56 | -0.36 |
| Nov | 6.45 | 5.80 | -0.65 |
| Dec | 5.74 | 5.63 | -0.10 |
| ⌀ Month | 9.08 | 8.87 | -0.21 |
Rain (mm)
| Month | ⌀ 1940 - 1950 | ⌀ 2013 - 2023 | +/- |
|---|---|---|---|
| Jan | 0.01 | 0.01 | 0.00 |
| Feb | 0.00 | 0.00 | 0.00 |
| Mar | 0.02 | 0.01 | -0.02 |
| Apr | 0.23 | 0.15 | -0.08 |
| May | 1.63 | 0.79 | -0.85 |
| Jun | 2.46 | 2.82 | 0.36 |
| Jul | 3.65 | 3.50 | -0.16 |
| Aug | 4.86 | 3.37 | -1.49 |
| Sep | 3.98 | 1.95 | -2.03 |
| Oct | 0.91 | 1.04 | 0.13 |
| Nov | 0.17 | 0.17 | -0.01 |
| Dec | 0.01 | 0.02 | 0.01 |
| ⌀ Month | 1.50 | 1.15 | -0.34 |
Snow (mm)
| Month | ⌀ 1940 - 1950 | ⌀ 2013 - 2023 | +/- |
|---|---|---|---|
| Jan | 1.59 | 2.43 | 0.83 |
| Feb | 1.78 | 2.09 | 0.31 |
| Mar | 1.91 | 2.24 | 0.33 |
| Apr | 2.67 | 2.90 | 0.23 |
| May | 2.88 | 3.09 | 0.21 |
| Jun | 0.53 | 0.52 | -0.01 |
| Jul | 0.08 | 0.16 | 0.08 |
| Aug | 0.04 | 0.22 | 0.17 |
| Sep | 0.65 | 0.43 | -0.22 |
| Oct | 2.61 | 2.44 | -0.17 |
| Nov | 2.54 | 4.06 | 1.52 |
| Dec | 1.69 | 2.26 | 0.56 |
| ⌀ Month | 1.58 | 1.90 | 0.32 |