Climate Change Chart of Yokohama, Japan
Comprehensive Climate Change Chart of Yokohama, Japan: Monthly Averages and Impact Trends
Explore the changing climate in Yokohama, Japan, through insightful data analysis.
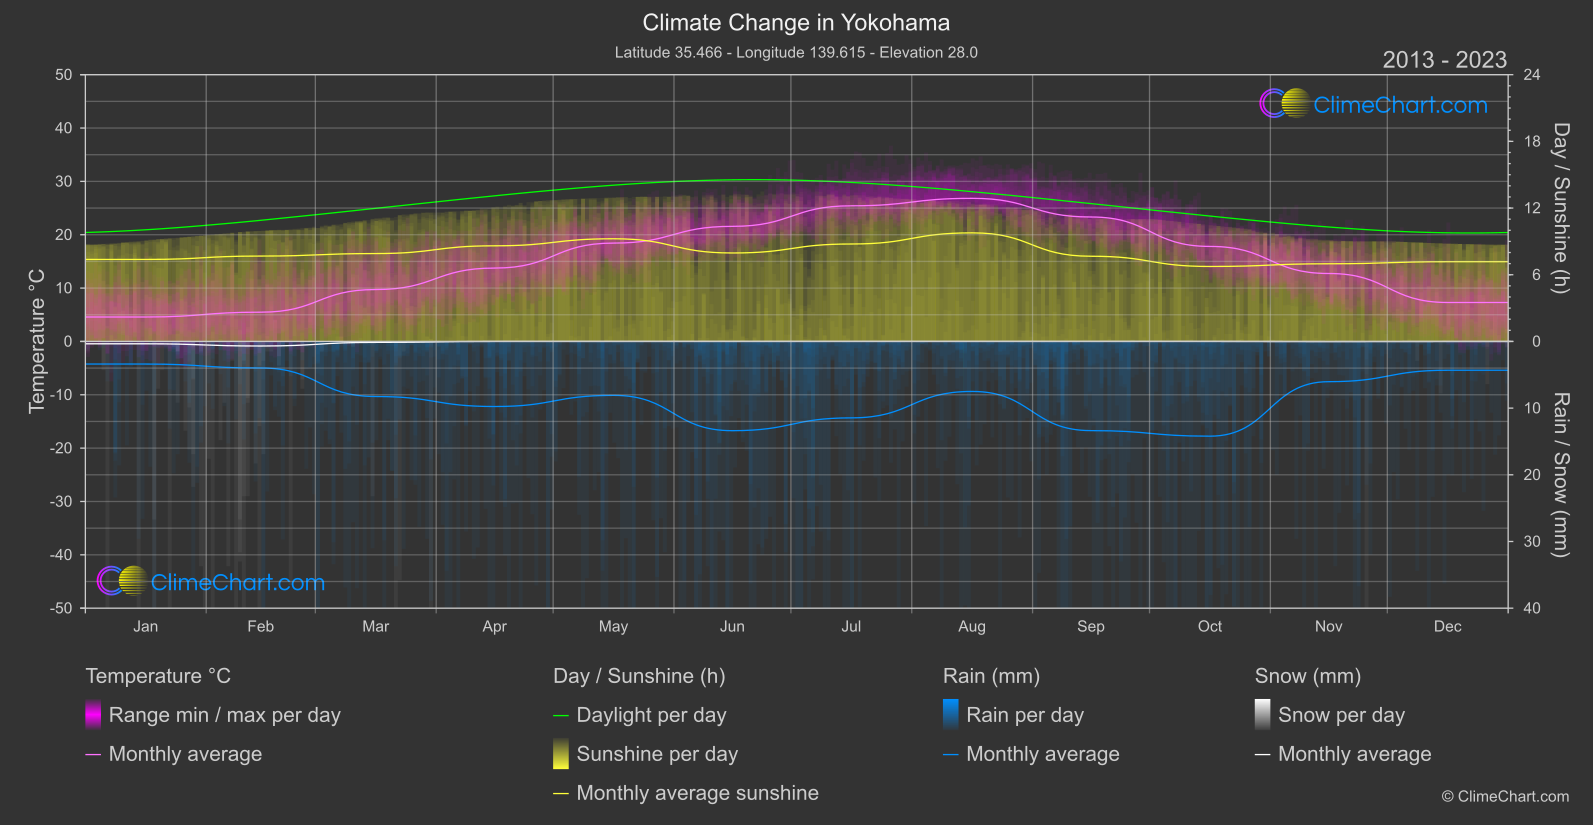
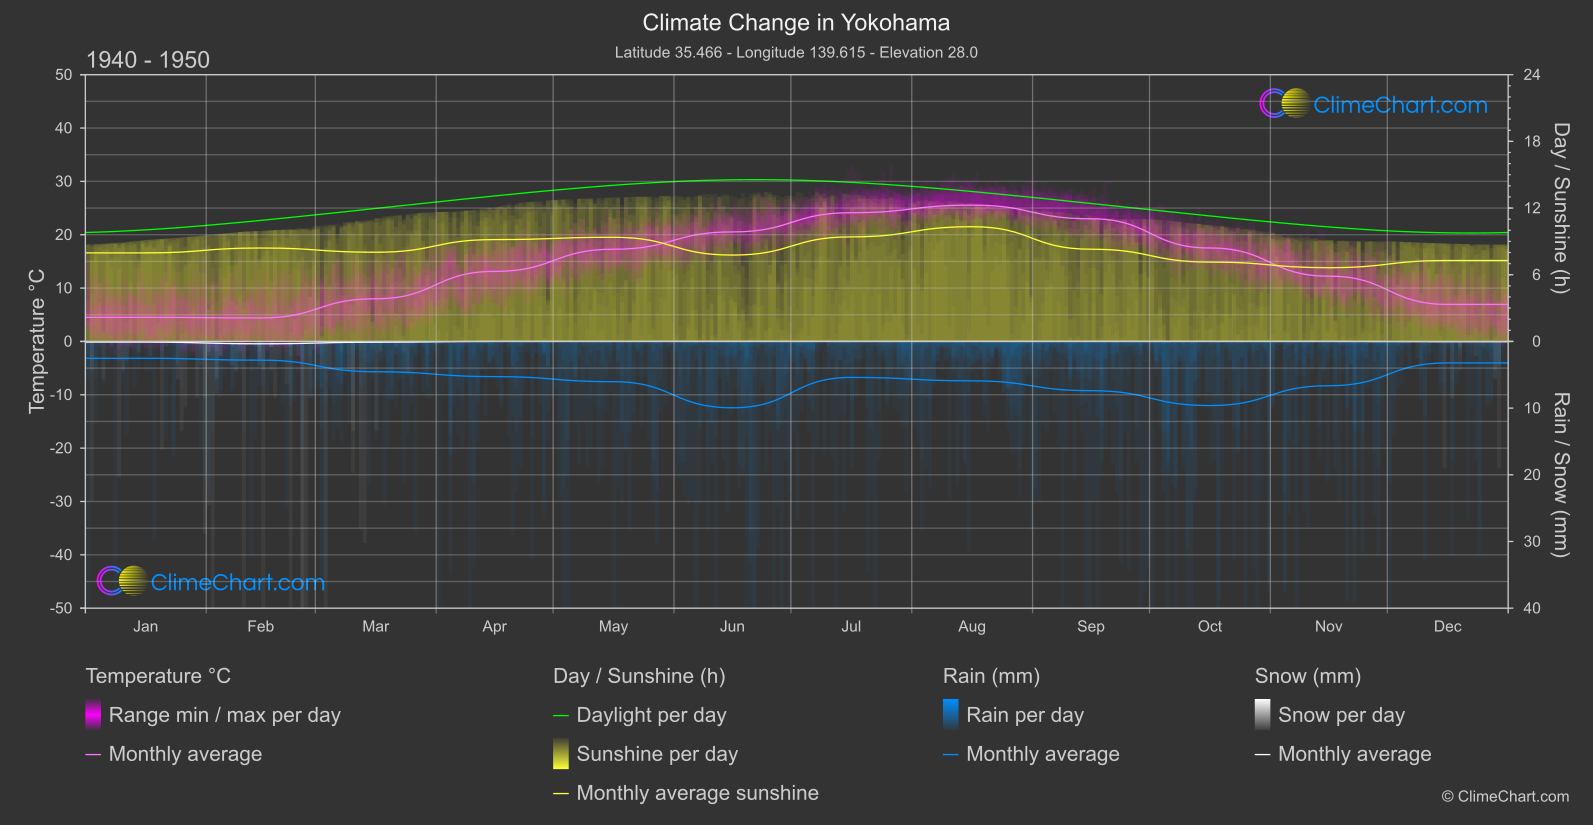
Yokohama, Japan, has experienced notable changes in temperature, rainfall, snowfall, and sunshine duration over the years. The data shows significant increases in temperatures across most months, with February showing the highest temperature change. Rainfall has also seen substantial variations, especially in July with a significant increase. Snowfall has decreased in recent years, with minimal to no snow in several months. Sunshine duration has shown mixed trends, with some months experiencing a decrease in sunlight hours. This data provides valuable insights into the evolving climate patterns in Yokohama, Japan.
Climate Change Data Overview for Yokohama, Japan
Explore the comprehensive climate change data for Yokohama, Japan. This detailed table provides valuable insights into temperature variations, precipitation levels, and seasonal changes influenced by climate change, helping you understand the unique weather patterns of this region.
Temperature °C
| Month | ⌀ 1940 - 1950 | ⌀ 2013 - 2023 | +/- |
|---|---|---|---|
| Jan | 4.51 | 4.58 | 0.07 |
| Feb | 4.40 | 5.48 | 1.08 |
| Mar | 8.00 | 9.73 | 1.73 |
| Apr | 13.13 | 13.75 | 0.63 |
| May | 17.29 | 18.43 | 1.15 |
| Jun | 20.53 | 21.57 | 1.04 |
| Jul | 24.13 | 25.42 | 1.29 |
| Aug | 25.55 | 26.82 | 1.27 |
| Sep | 22.99 | 23.32 | 0.34 |
| Oct | 17.51 | 17.81 | 0.30 |
| Nov | 12.23 | 12.73 | 0.50 |
| Dec | 6.94 | 7.30 | 0.36 |
| ⌀ Month | 14.77 | 15.58 | 0.81 |
Sunshine (h)
| Month | ⌀ 1940 - 1950 | ⌀ 2013 - 2023 | +/- |
|---|---|---|---|
| Jan | 7.97 | 7.38 | -0.59 |
| Feb | 8.41 | 7.68 | -0.72 |
| Mar | 8.03 | 7.91 | -0.12 |
| Apr | 9.16 | 8.60 | -0.56 |
| May | 9.37 | 9.24 | -0.13 |
| Jun | 7.77 | 7.96 | 0.19 |
| Jul | 9.41 | 8.77 | -0.64 |
| Aug | 10.32 | 9.77 | -0.56 |
| Sep | 8.30 | 7.66 | -0.63 |
| Oct | 7.14 | 6.75 | -0.40 |
| Nov | 6.64 | 6.99 | 0.35 |
| Dec | 7.28 | 7.17 | -0.11 |
| ⌀ Month | 8.32 | 7.99 | -0.33 |
Rain (mm)
| Month | ⌀ 1940 - 1950 | ⌀ 2013 - 2023 | +/- |
|---|---|---|---|
| Jan | 1.26 | 1.70 | 0.43 |
| Feb | 1.40 | 1.99 | 0.59 |
| Mar | 2.27 | 4.13 | 1.86 |
| Apr | 2.64 | 4.88 | 2.24 |
| May | 3.02 | 4.04 | 1.02 |
| Jun | 4.97 | 6.69 | 1.72 |
| Jul | 2.70 | 5.73 | 3.03 |
| Aug | 2.96 | 3.75 | 0.79 |
| Sep | 3.69 | 6.69 | 3.00 |
| Oct | 4.81 | 7.10 | 2.29 |
| Nov | 3.32 | 3.02 | -0.30 |
| Dec | 1.61 | 2.16 | 0.55 |
| ⌀ Month | 2.89 | 4.32 | 1.43 |
Snow (mm)
| Month | ⌀ 1940 - 1950 | ⌀ 2013 - 2023 | +/- |
|---|---|---|---|
| Jan | 0.05 | 0.18 | 0.13 |
| Feb | 0.18 | 0.34 | 0.17 |
| Mar | 0.06 | 0.07 | 0.01 |
| Apr | 0.00 | 0.00 | 0.00 |
| May | 0.00 | 0.00 | 0.00 |
| Jun | 0.00 | 0.00 | 0.00 |
| Jul | 0.00 | 0.00 | 0.00 |
| Aug | 0.00 | 0.00 | 0.00 |
| Sep | 0.00 | 0.00 | 0.00 |
| Oct | 0.00 | 0.00 | 0.00 |
| Nov | 0.00 | 0.01 | 0.01 |
| Dec | 0.02 | 0.01 | -0.01 |
| ⌀ Month | 0.03 | 0.05 | 0.03 |