Climate Change Chart of Yekaterinburg (Sverdlovsk), Russian Federation
Comprehensive Climate Change Chart of Yekaterinburg (Sverdlovsk), Russian Federation: Monthly Averages and Impact Trends
Exploring the changing climate in Yekaterinburg (Sverdlovsk), Russian Federation reveals intriguing insights. Dive into the data to uncover trends and patterns.
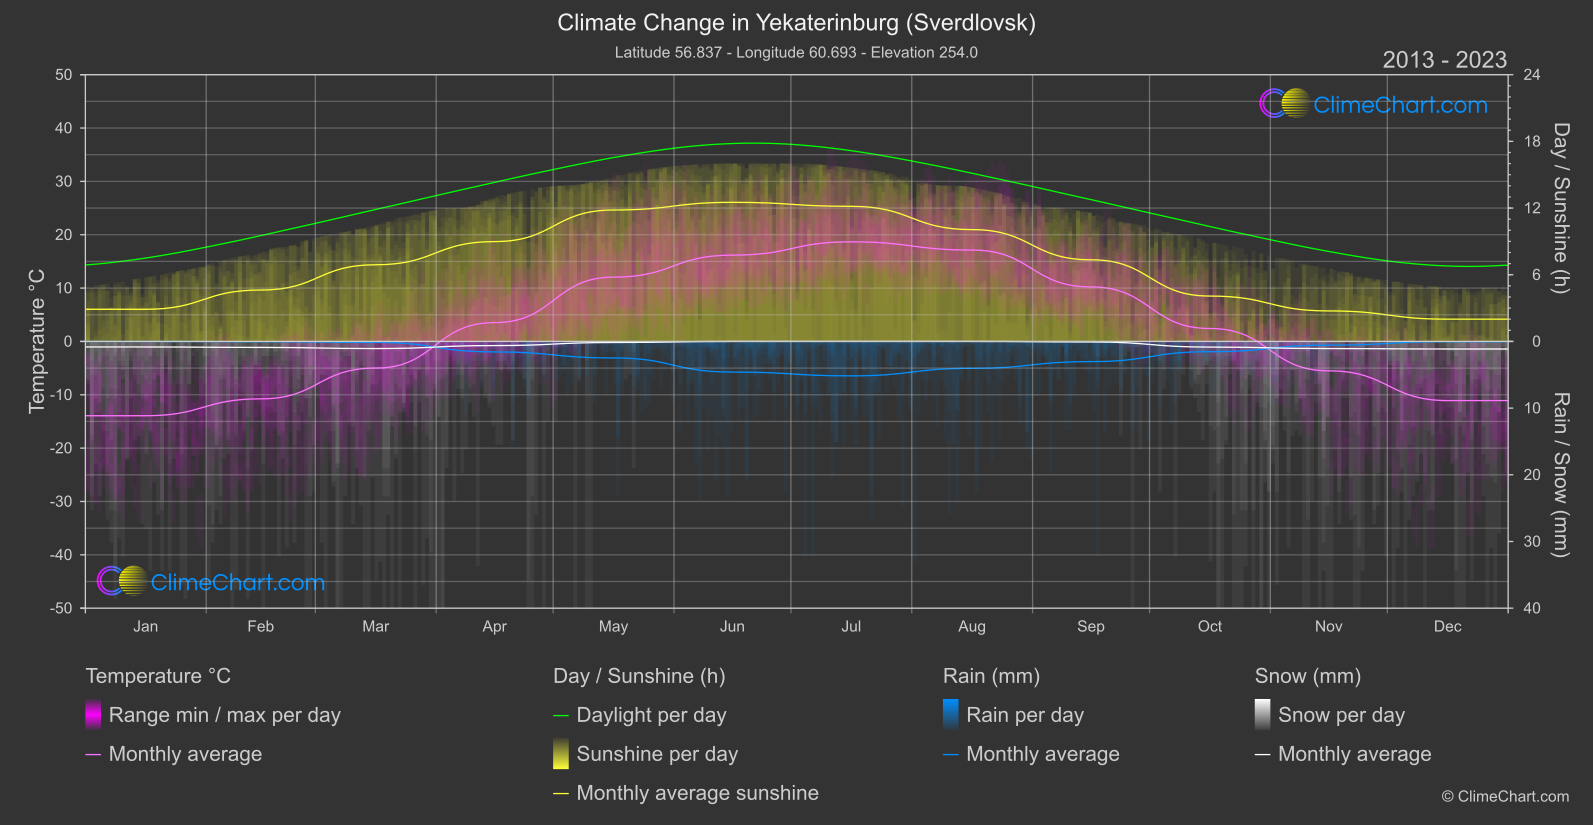
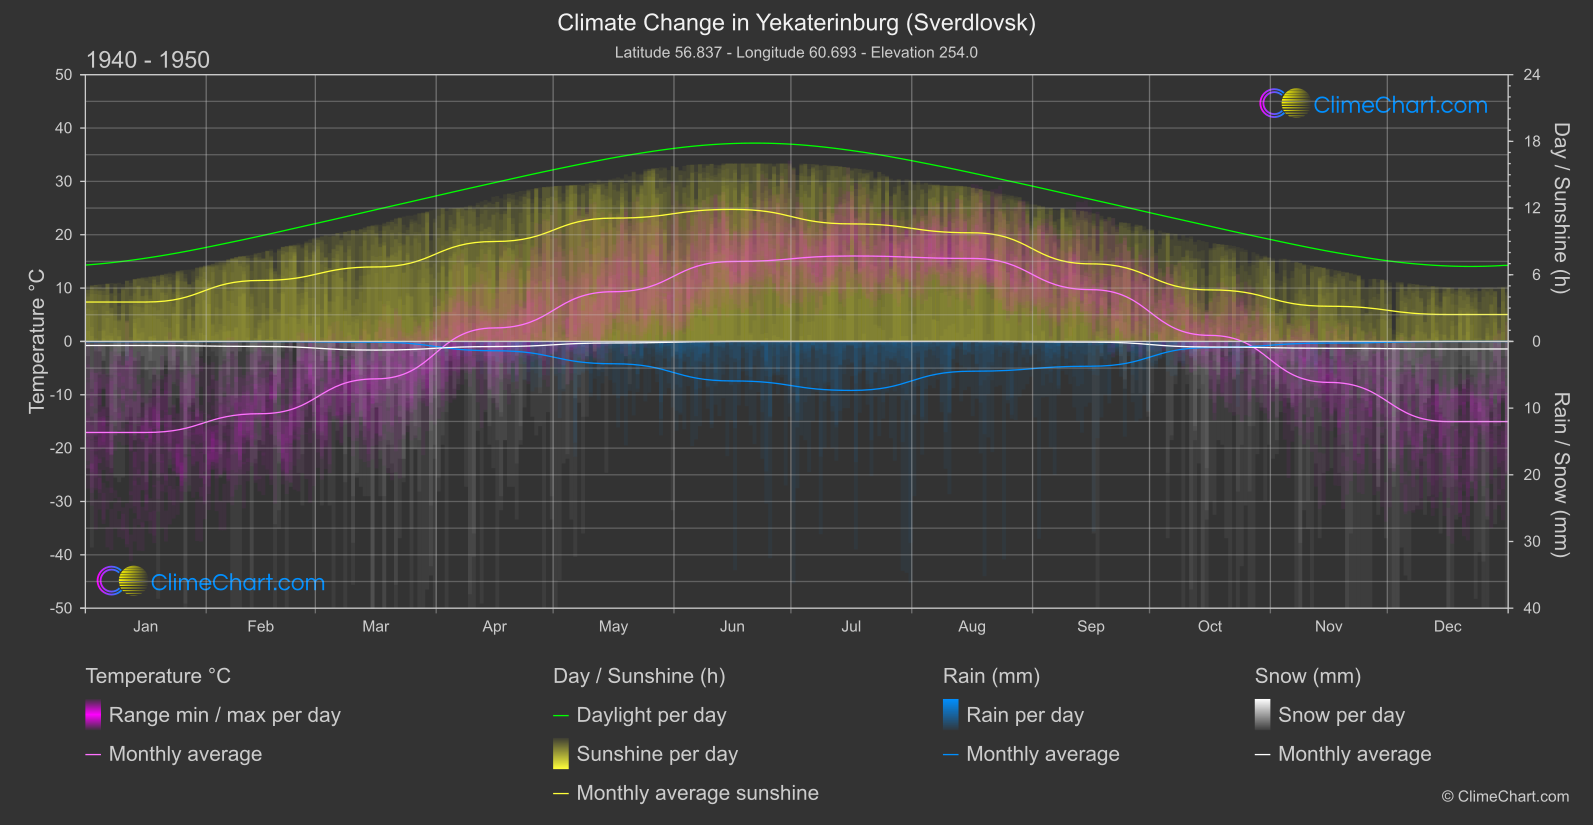
Yekaterinburg (Sverdlovsk), located in the Russian Federation, experiences notable changes in temperature, rainfall, snowfall, and sunshine duration. Comparing data from 1940-1950 to 2013-2024, certain trends emerge. For instance, the month with the highest temperature change is December, showing a significant increase of 3.94°C. Conversely, May experiences the largest decrease in rainfall, with a -0.44mm change. These fluctuations in climate metrics provide valuable insights into the changing weather patterns of the region.
Climate Change Data Overview for Yekaterinburg (Sverdlovsk), Russian Federation
Explore the comprehensive climate change data for Yekaterinburg (Sverdlovsk), Russian Federation. This detailed table provides valuable insights into temperature variations, precipitation levels, and seasonal changes influenced by climate change, helping you understand the unique weather patterns of this region.
Temperature °C
| Month | ⌀ 1940 - 1950 | ⌀ 2013 - 2023 | +/- |
|---|---|---|---|
| Jan | -17.06 | -13.93 | 3.14 |
| Feb | -13.54 | -10.76 | 2.78 |
| Mar | -7.02 | -4.99 | 2.02 |
| Apr | 2.53 | 3.53 | 1.00 |
| May | 9.32 | 12.05 | 2.73 |
| Jun | 14.98 | 16.18 | 1.19 |
| Jul | 16.02 | 18.67 | 2.65 |
| Aug | 15.56 | 17.13 | 1.57 |
| Sep | 9.71 | 10.22 | 0.51 |
| Oct | 1.13 | 2.42 | 1.29 |
| Nov | -7.68 | -5.51 | 2.16 |
| Dec | -15.03 | -11.09 | 3.94 |
| ⌀ Month | 0.74 | 2.83 | 2.08 |
Sunshine (h)
| Month | ⌀ 1940 - 1950 | ⌀ 2013 - 2023 | +/- |
|---|---|---|---|
| Jan | 3.55 | 2.89 | -0.65 |
| Feb | 5.49 | 4.62 | -0.86 |
| Mar | 6.70 | 6.90 | 0.20 |
| Apr | 8.99 | 8.99 | -0.01 |
| May | 11.09 | 11.83 | 0.73 |
| Jun | 11.88 | 12.51 | 0.63 |
| Jul | 10.58 | 12.16 | 1.58 |
| Aug | 9.77 | 10.06 | 0.29 |
| Sep | 6.98 | 7.34 | 0.37 |
| Oct | 4.64 | 4.08 | -0.56 |
| Nov | 3.17 | 2.74 | -0.42 |
| Dec | 2.42 | 2.00 | -0.42 |
| ⌀ Month | 7.10 | 7.18 | 0.07 |
Rain (mm)
| Month | ⌀ 1940 - 1950 | ⌀ 2013 - 2023 | +/- |
|---|---|---|---|
| Jan | 0.01 | 0.00 | -0.01 |
| Feb | 0.00 | 0.02 | 0.02 |
| Mar | 0.06 | 0.07 | 0.02 |
| Apr | 0.70 | 0.79 | 0.09 |
| May | 1.67 | 1.24 | -0.44 |
| Jun | 2.96 | 2.30 | -0.67 |
| Jul | 3.67 | 2.58 | -1.09 |
| Aug | 2.23 | 2.01 | -0.22 |
| Sep | 1.86 | 1.51 | -0.35 |
| Oct | 0.46 | 0.77 | 0.31 |
| Nov | 0.12 | 0.28 | 0.16 |
| Dec | 0.00 | 0.02 | 0.01 |
| ⌀ Month | 1.15 | 0.97 | -0.18 |
Snow (mm)
| Month | ⌀ 1940 - 1950 | ⌀ 2013 - 2023 | +/- |
|---|---|---|---|
| Jan | 0.31 | 0.42 | 0.11 |
| Feb | 0.38 | 0.45 | 0.07 |
| Mar | 0.65 | 0.53 | -0.11 |
| Apr | 0.38 | 0.31 | -0.07 |
| May | 0.11 | 0.08 | -0.03 |
| Jun | 0.00 | 0.00 | -0.00 |
| Jul | 0.00 | 0.00 | 0.00 |
| Aug | 0.00 | 0.00 | 0.00 |
| Sep | 0.05 | 0.04 | -0.01 |
| Oct | 0.42 | 0.42 | 0.01 |
| Nov | 0.51 | 0.53 | 0.02 |
| Dec | 0.56 | 0.57 | 0.00 |
| ⌀ Month | 0.28 | 0.28 | -0.00 |