Climate Change Chart of Yangon, Myanmar
Comprehensive Climate Change Chart of Yangon, Myanmar: Monthly Averages and Impact Trends
Exploring the changing climate in Yangon, Myanmar reveals intriguing insights.
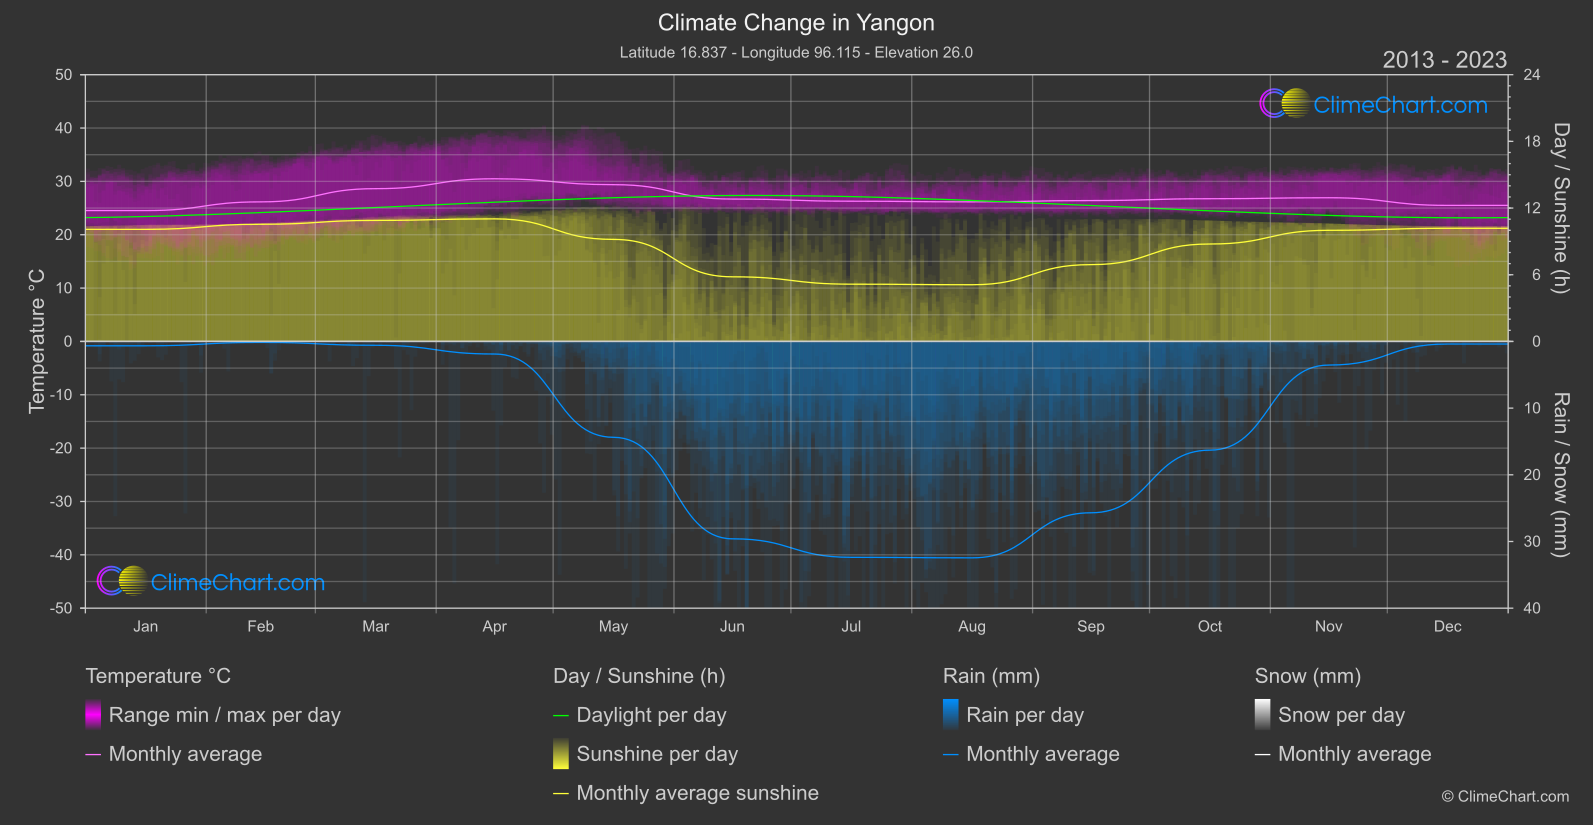
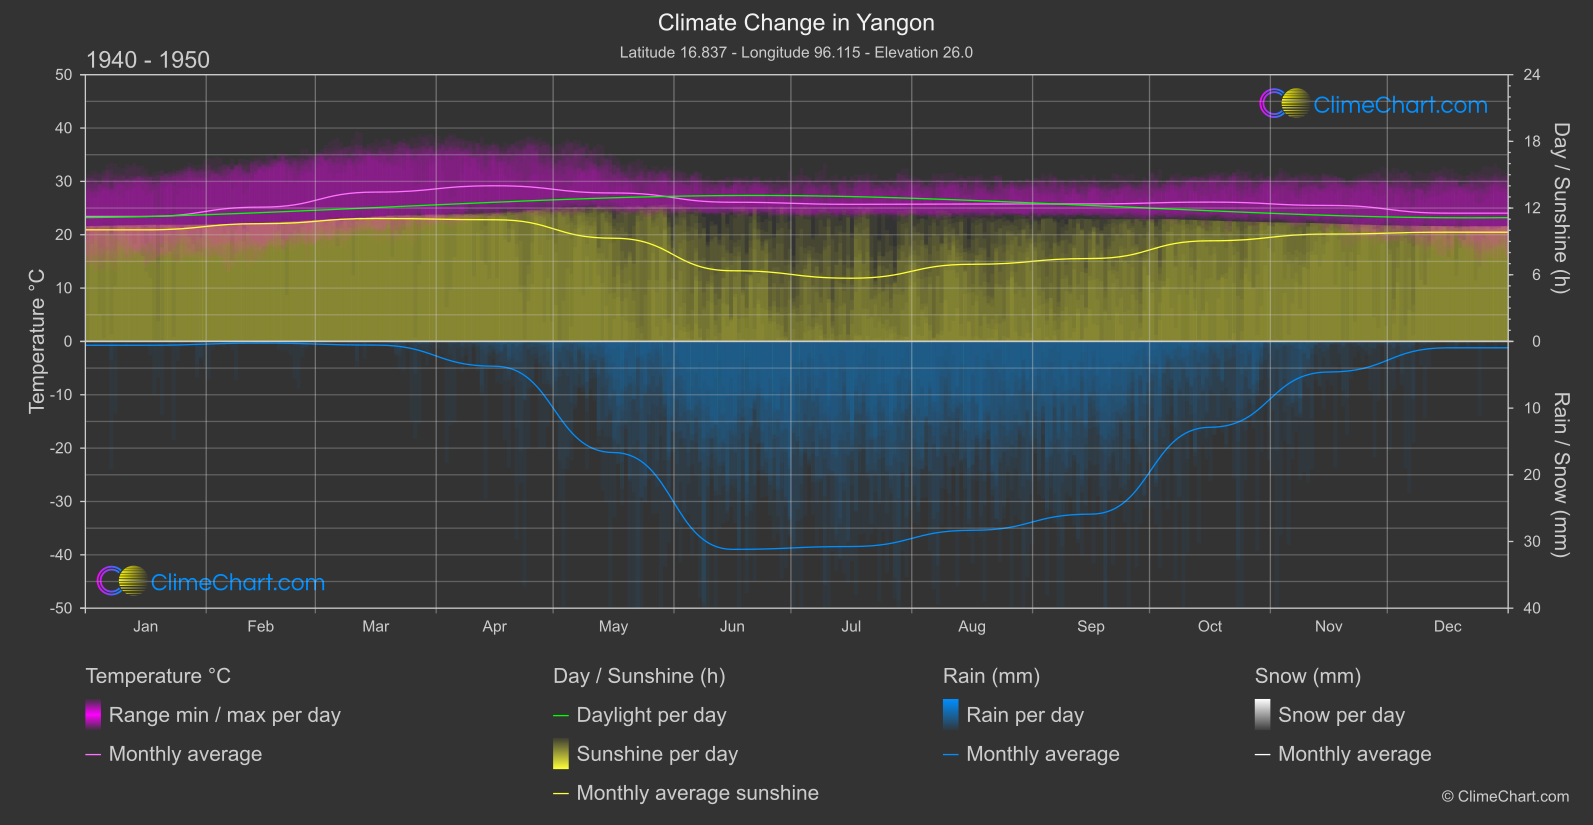
Yangon, the largest city in Myanmar, experiences notable changes in temperature, rainfall, and sunshine duration. From the data comparison between 1940-1950 and 2013-2024, it is evident that there is a consistent increase in temperature across most months, with significant changes in rainfall as well. The month of May stands out with a substantial increase in temperature and a significant decrease in rainfall. Furthermore, the sunshine duration has shown a noticeable decrease over the years.
Climate Change Data Overview for Yangon, Myanmar
Explore the comprehensive climate change data for Yangon, Myanmar. This detailed table provides valuable insights into temperature variations, precipitation levels, and seasonal changes influenced by climate change, helping you understand the unique weather patterns of this region.
Temperature °C
| Month | ⌀ 1940 - 1950 | ⌀ 2013 - 2023 | +/- |
|---|---|---|---|
| Jan | 23.42 | 24.53 | 1.11 |
| Feb | 25.17 | 26.16 | 0.99 |
| Mar | 27.99 | 28.64 | 0.64 |
| Apr | 29.18 | 30.49 | 1.31 |
| May | 27.83 | 29.38 | 1.56 |
| Jun | 26.09 | 26.69 | 0.60 |
| Jul | 25.70 | 26.29 | 0.58 |
| Aug | 25.75 | 26.16 | 0.41 |
| Sep | 25.78 | 26.41 | 0.62 |
| Oct | 26.12 | 26.75 | 0.63 |
| Nov | 25.49 | 26.93 | 1.44 |
| Dec | 24.05 | 25.50 | 1.46 |
| ⌀ Month | 26.05 | 26.99 | 0.95 |
Sunshine (h)
| Month | ⌀ 1940 - 1950 | ⌀ 2013 - 2023 | +/- |
|---|---|---|---|
| Jan | 10.04 | 10.08 | 0.04 |
| Feb | 10.60 | 10.54 | -0.06 |
| Mar | 11.06 | 10.89 | -0.17 |
| Apr | 10.95 | 11.03 | 0.08 |
| May | 9.29 | 9.18 | -0.11 |
| Jun | 6.36 | 5.81 | -0.55 |
| Jul | 5.69 | 5.15 | -0.54 |
| Aug | 6.94 | 5.10 | -1.84 |
| Sep | 7.46 | 6.91 | -0.55 |
| Oct | 9.05 | 8.77 | -0.29 |
| Nov | 9.66 | 10.00 | 0.34 |
| Dec | 9.83 | 10.18 | 0.35 |
| ⌀ Month | 8.91 | 8.64 | -0.27 |
Rain (mm)
| Month | ⌀ 1940 - 1950 | ⌀ 2013 - 2023 | +/- |
|---|---|---|---|
| Jan | 0.29 | 0.33 | 0.04 |
| Feb | 0.13 | 0.07 | -0.05 |
| Mar | 0.27 | 0.29 | 0.02 |
| Apr | 1.86 | 0.94 | -0.91 |
| May | 8.33 | 7.19 | -1.14 |
| Jun | 15.59 | 14.80 | -0.79 |
| Jul | 15.38 | 16.19 | 0.81 |
| Aug | 14.16 | 16.23 | 2.06 |
| Sep | 12.95 | 12.85 | -0.10 |
| Oct | 6.44 | 8.15 | 1.71 |
| Nov | 2.29 | 1.77 | -0.52 |
| Dec | 0.48 | 0.19 | -0.28 |
| ⌀ Month | 6.51 | 6.58 | 0.07 |
Snow (mm)
| Month | ⌀ 1940 - 1950 | ⌀ 2013 - 2023 | +/- |
|---|---|---|---|
| Jan | 0.00 | 0.00 | 0.00 |
| Feb | 0.00 | 0.00 | 0.00 |
| Mar | 0.00 | 0.00 | 0.00 |
| Apr | 0.00 | 0.00 | 0.00 |
| May | 0.00 | 0.00 | 0.00 |
| Jun | 0.00 | 0.00 | 0.00 |
| Jul | 0.00 | 0.00 | 0.00 |
| Aug | 0.00 | 0.00 | 0.00 |
| Sep | 0.00 | 0.00 | 0.00 |
| Oct | 0.00 | 0.00 | 0.00 |
| Nov | 0.00 | 0.00 | 0.00 |
| Dec | 0.00 | 0.00 | 0.00 |
| ⌀ Month | 0.00 | 0.00 | 0.00 |