Climate Change Chart of Xi'an, China
Comprehensive Climate Change Chart of Xi'an, China: Monthly Averages and Impact Trends
Exploring the climate changes in Xi'an, China reveals intriguing insights into the shifting weather patterns over the decades.
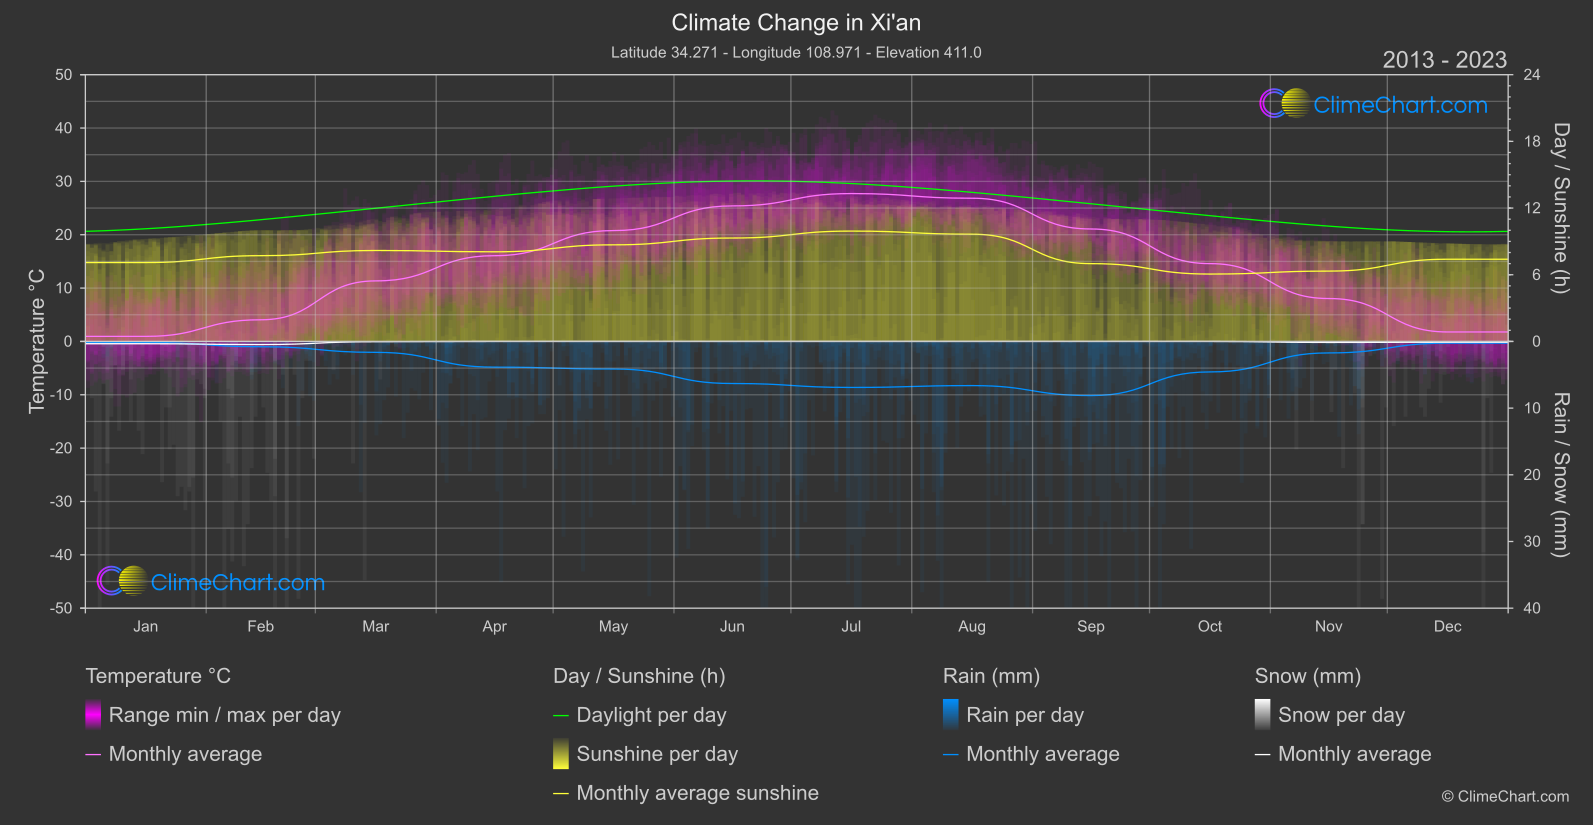
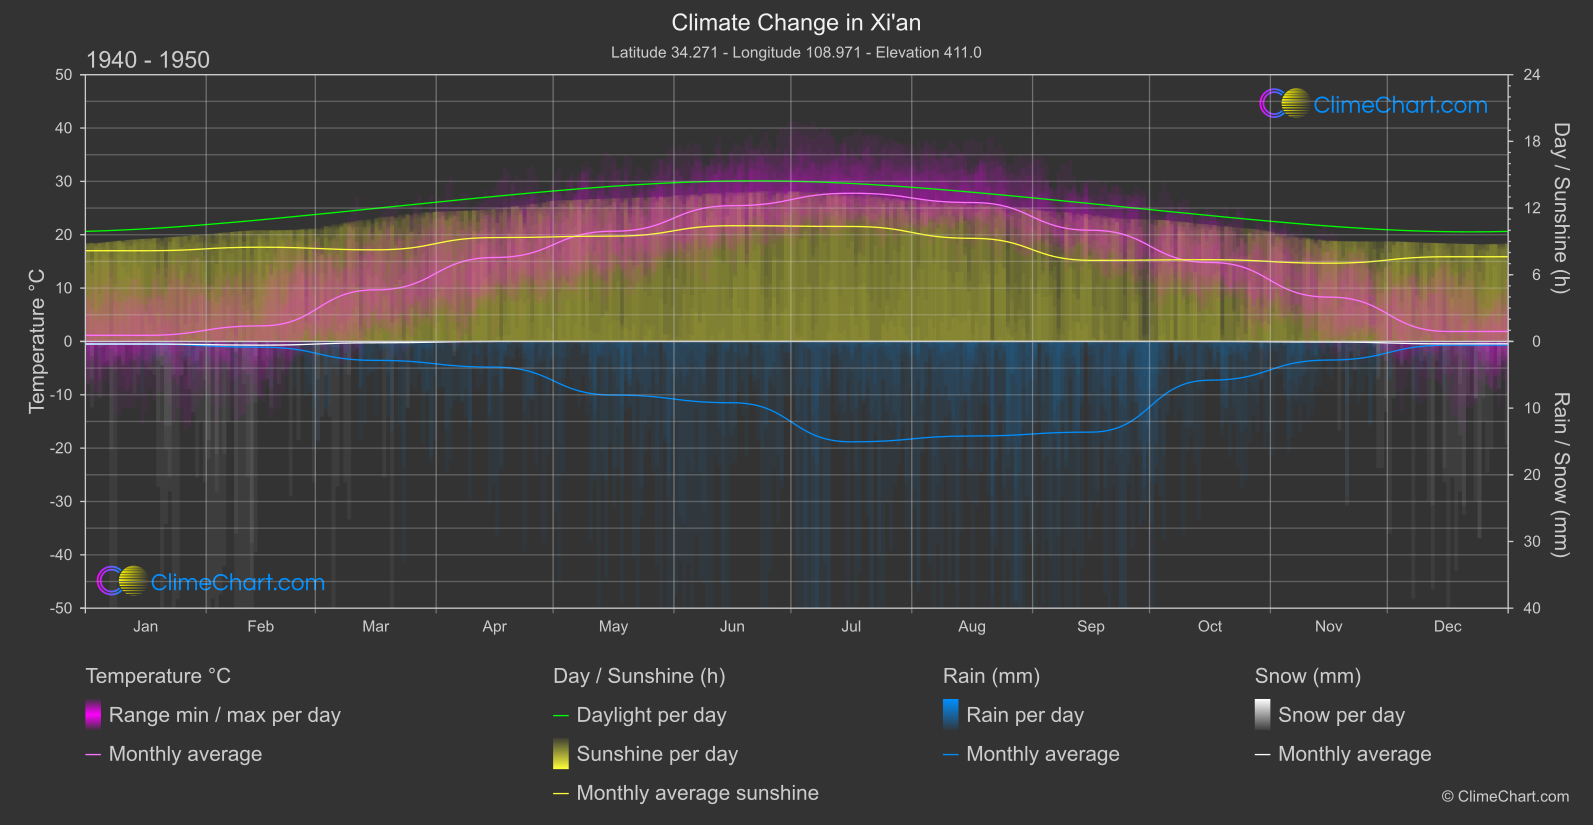
Xi'an, with its rich historical significance, has witnessed notable climate changes over the years. The data shows variations in temperature, rainfall, snowfall, and sunshine duration, providing valuable insights into how the climate in Xi'an has evolved. Analysis of the data indicates shifts in weather patterns, with some months experiencing significant changes in temperature or precipitation levels.
Climate Change Data Overview for Xi'an, China
Explore the comprehensive climate change data for Xi'an, China. This detailed table provides valuable insights into temperature variations, precipitation levels, and seasonal changes influenced by climate change, helping you understand the unique weather patterns of this region.
Temperature °C
| Month | ⌀ 1940 - 1950 | ⌀ 2013 - 2023 | +/- |
|---|---|---|---|
| Jan | 1.14 | 0.95 | -0.19 |
| Feb | 2.91 | 4.06 | 1.15 |
| Mar | 9.67 | 11.35 | 1.68 |
| Apr | 15.73 | 16.07 | 0.34 |
| May | 20.66 | 20.78 | 0.12 |
| Jun | 25.45 | 25.40 | -0.04 |
| Jul | 27.78 | 27.72 | -0.06 |
| Aug | 26.03 | 26.84 | 0.81 |
| Sep | 20.84 | 21.08 | 0.24 |
| Oct | 14.80 | 14.59 | -0.21 |
| Nov | 8.31 | 8.04 | -0.27 |
| Dec | 1.87 | 1.77 | -0.10 |
| ⌀ Month | 14.60 | 14.89 | 0.29 |
Sunshine (h)
| Month | ⌀ 1940 - 1950 | ⌀ 2013 - 2023 | +/- |
|---|---|---|---|
| Jan | 8.16 | 7.10 | -1.06 |
| Feb | 8.48 | 7.72 | -0.76 |
| Mar | 8.24 | 8.18 | -0.06 |
| Apr | 9.34 | 8.06 | -1.28 |
| May | 9.48 | 8.69 | -0.79 |
| Jun | 10.41 | 9.30 | -1.11 |
| Jul | 10.34 | 9.93 | -0.42 |
| Aug | 9.28 | 9.65 | 0.37 |
| Sep | 7.29 | 7.00 | -0.29 |
| Oct | 7.35 | 6.06 | -1.29 |
| Nov | 7.04 | 6.33 | -0.71 |
| Dec | 7.62 | 7.40 | -0.22 |
| ⌀ Month | 8.59 | 7.95 | -0.64 |
Rain (mm)
| Month | ⌀ 1940 - 1950 | ⌀ 2013 - 2023 | +/- |
|---|---|---|---|
| Jan | 0.20 | 0.07 | -0.13 |
| Feb | 0.43 | 0.40 | -0.03 |
| Mar | 1.42 | 0.82 | -0.60 |
| Apr | 1.93 | 1.93 | -0.00 |
| May | 4.02 | 2.07 | -1.96 |
| Jun | 4.60 | 3.15 | -1.44 |
| Jul | 7.53 | 3.45 | -4.08 |
| Aug | 7.09 | 3.31 | -3.78 |
| Sep | 6.80 | 4.06 | -2.74 |
| Oct | 2.90 | 2.29 | -0.62 |
| Nov | 1.40 | 0.86 | -0.53 |
| Dec | 0.28 | 0.13 | -0.15 |
| ⌀ Month | 3.22 | 1.88 | -1.34 |
Snow (mm)
| Month | ⌀ 1940 - 1950 | ⌀ 2013 - 2023 | +/- |
|---|---|---|---|
| Jan | 0.19 | 0.17 | -0.02 |
| Feb | 0.28 | 0.23 | -0.04 |
| Mar | 0.10 | 0.02 | -0.08 |
| Apr | 0.00 | 0.00 | -0.00 |
| May | 0.00 | 0.00 | 0.00 |
| Jun | 0.00 | 0.00 | 0.00 |
| Jul | 0.00 | 0.00 | 0.00 |
| Aug | 0.00 | 0.00 | 0.00 |
| Sep | 0.00 | 0.00 | 0.00 |
| Oct | 0.00 | 0.00 | -0.00 |
| Nov | 0.05 | 0.08 | 0.03 |
| Dec | 0.18 | 0.06 | -0.12 |
| ⌀ Month | 0.07 | 0.05 | -0.02 |