Climate Change Chart of Xiamen, China
Comprehensive Climate Change Chart of Xiamen, China: Monthly Averages and Impact Trends
Explore the changing climate of Xiamen, China through insightful data analysis. Discover how temperatures, rainfall, and sunshine duration have evolved over the years.
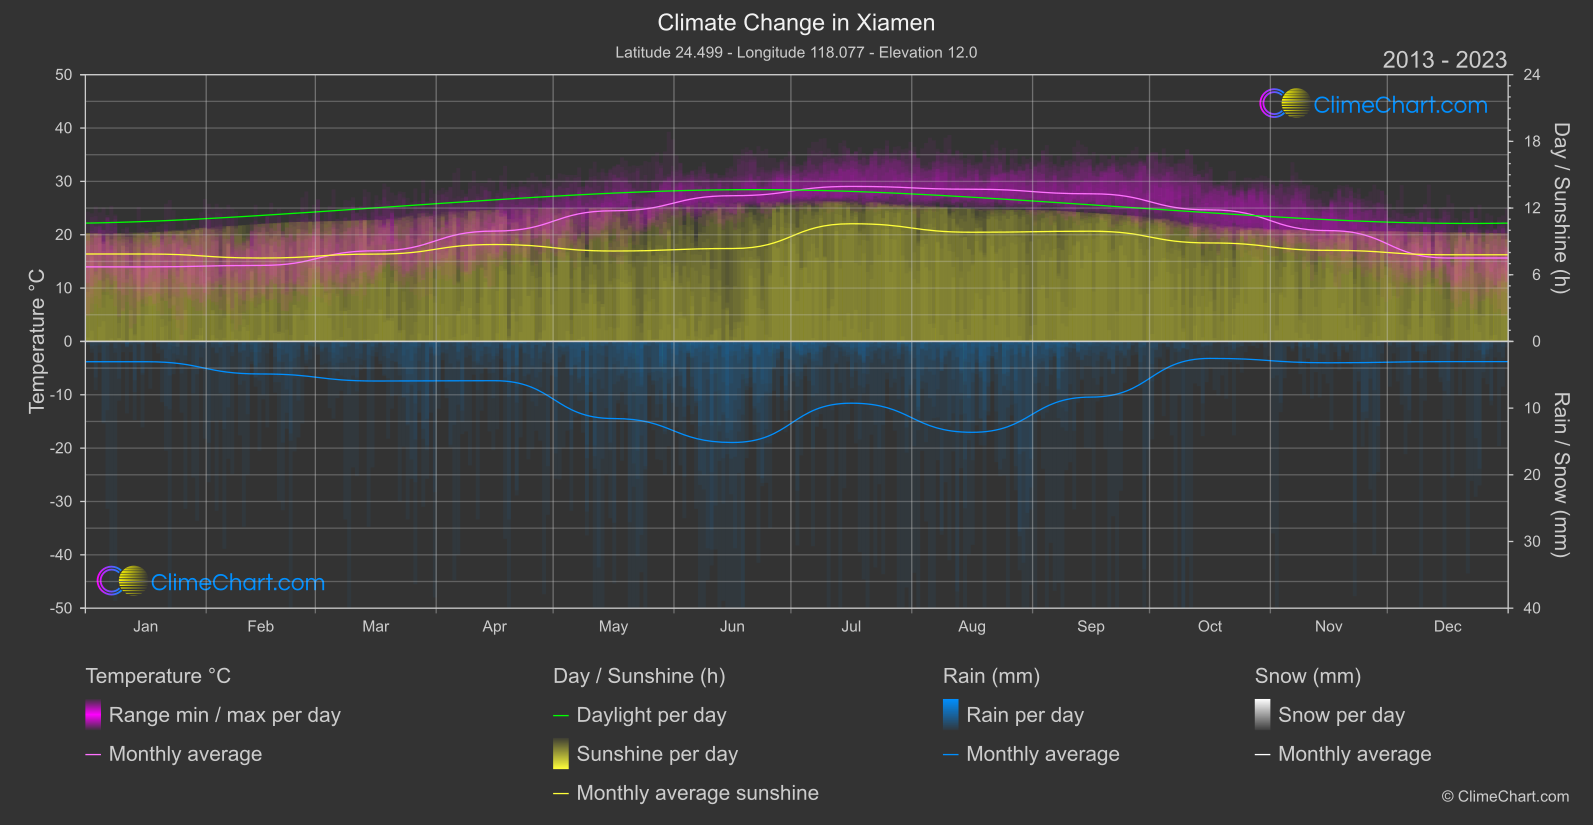
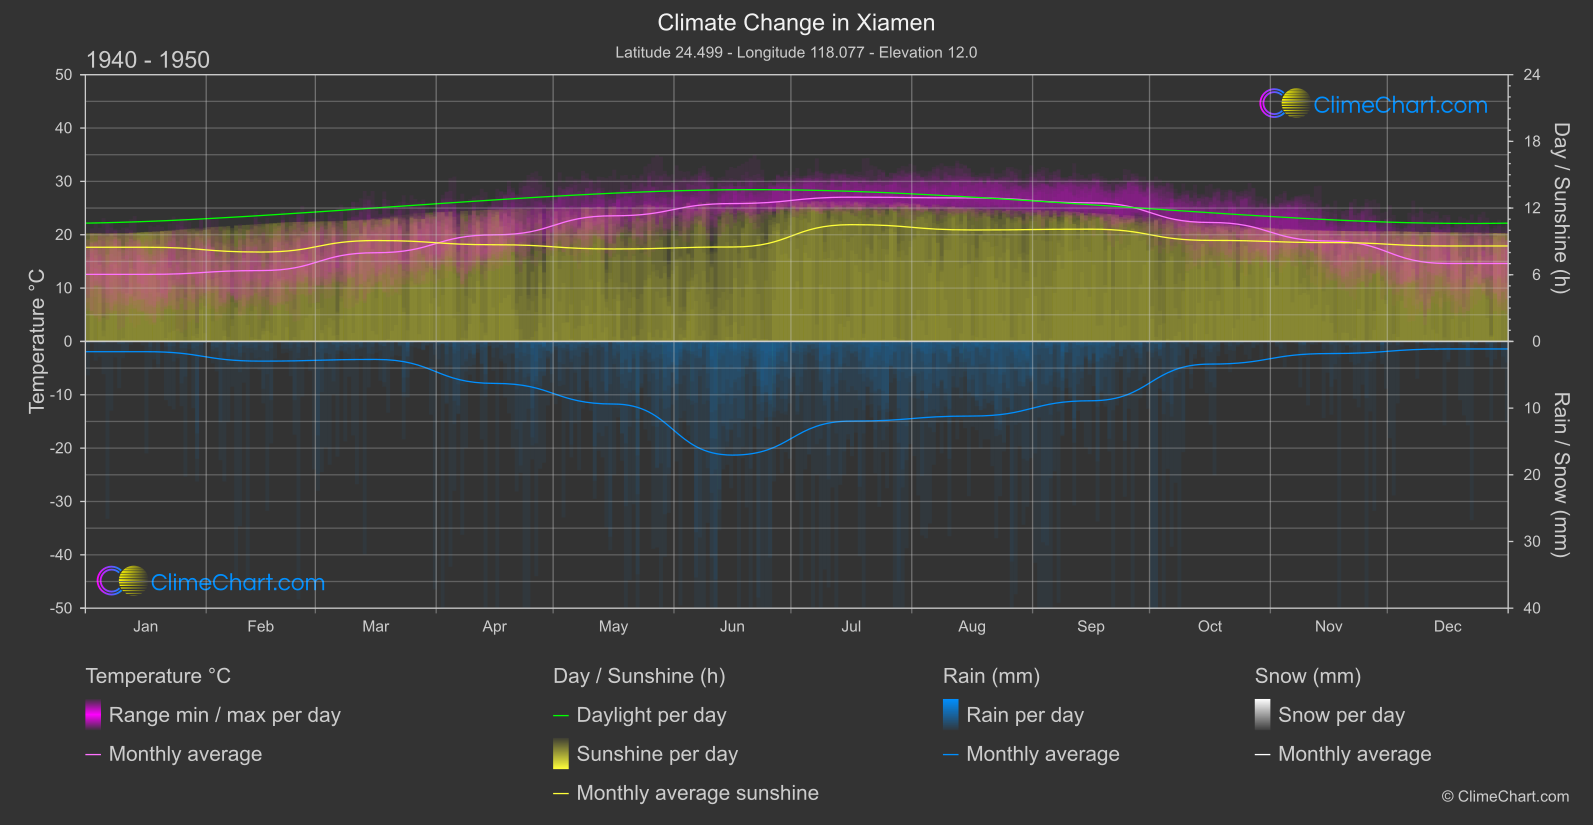
Xiamen, a coastal city in China, has experienced notable changes in its climate over the years. Analyzing data from the 1940s to the 1950s compared to recent years from 2013 to 2024 reveals interesting trends. The month of October stands out with a significant temperature increase of 2.36°C and a decrease in rainfall by 0.43 mm. July shows the highest temperature change of 2.02°C, while March experienced the largest increase in rainfall by 1.62 mm. Sunshine duration also fluctuated, with notable decreases in December and November.
Climate Change Data Overview for Xiamen, China
Explore the comprehensive climate change data for Xiamen, China. This detailed table provides valuable insights into temperature variations, precipitation levels, and seasonal changes influenced by climate change, helping you understand the unique weather patterns of this region.
Temperature °C
| Month | ⌀ 1940 - 1950 | ⌀ 2013 - 2023 | +/- |
|---|---|---|---|
| Jan | 12.57 | 13.98 | 1.41 |
| Feb | 13.28 | 14.25 | 0.97 |
| Mar | 16.63 | 16.99 | 0.36 |
| Apr | 19.98 | 20.68 | 0.70 |
| May | 23.55 | 24.49 | 0.94 |
| Jun | 25.84 | 27.32 | 1.47 |
| Jul | 27.04 | 29.06 | 2.02 |
| Aug | 26.90 | 28.53 | 1.63 |
| Sep | 25.98 | 27.67 | 1.70 |
| Oct | 22.30 | 24.66 | 2.36 |
| Nov | 18.82 | 20.77 | 1.95 |
| Dec | 14.61 | 15.64 | 1.03 |
| ⌀ Month | 20.62 | 22.00 | 1.38 |
Sunshine (h)
| Month | ⌀ 1940 - 1950 | ⌀ 2013 - 2023 | +/- |
|---|---|---|---|
| Jan | 8.47 | 7.87 | -0.61 |
| Feb | 8.04 | 7.50 | -0.54 |
| Mar | 9.08 | 7.86 | -1.22 |
| Apr | 8.70 | 8.72 | 0.02 |
| May | 8.32 | 8.14 | -0.18 |
| Jun | 8.50 | 8.36 | -0.14 |
| Jul | 10.51 | 10.59 | 0.08 |
| Aug | 10.03 | 9.82 | -0.21 |
| Sep | 10.10 | 9.92 | -0.18 |
| Oct | 9.09 | 8.86 | -0.23 |
| Nov | 8.90 | 8.20 | -0.70 |
| Dec | 8.59 | 7.80 | -0.79 |
| ⌀ Month | 9.03 | 8.64 | -0.39 |
Rain (mm)
| Month | ⌀ 1940 - 1950 | ⌀ 2013 - 2023 | +/- |
|---|---|---|---|
| Jan | 0.77 | 1.52 | 0.75 |
| Feb | 1.48 | 2.44 | 0.96 |
| Mar | 1.35 | 2.97 | 1.62 |
| Apr | 3.15 | 2.94 | -0.20 |
| May | 4.69 | 5.78 | 1.09 |
| Jun | 8.52 | 7.58 | -0.95 |
| Jul | 5.97 | 4.63 | -1.34 |
| Aug | 5.59 | 6.81 | 1.22 |
| Sep | 4.45 | 4.17 | -0.28 |
| Oct | 1.70 | 1.27 | -0.43 |
| Nov | 0.91 | 1.60 | 0.69 |
| Dec | 0.56 | 1.51 | 0.95 |
| ⌀ Month | 3.26 | 3.60 | 0.34 |
Snow (mm)
| Month | ⌀ 1940 - 1950 | ⌀ 2013 - 2023 | +/- |
|---|---|---|---|
| Jan | 0.00 | 0.00 | 0.00 |
| Feb | 0.00 | 0.00 | 0.00 |
| Mar | 0.00 | 0.00 | 0.00 |
| Apr | 0.00 | 0.00 | 0.00 |
| May | 0.00 | 0.00 | 0.00 |
| Jun | 0.00 | 0.00 | 0.00 |
| Jul | 0.00 | 0.00 | 0.00 |
| Aug | 0.00 | 0.00 | 0.00 |
| Sep | 0.00 | 0.00 | 0.00 |
| Oct | 0.00 | 0.00 | 0.00 |
| Nov | 0.00 | 0.00 | 0.00 |
| Dec | 0.00 | 0.00 | 0.00 |
| ⌀ Month | 0.00 | 0.00 | 0.00 |