Climate Change Chart of Whitefish Mountain, USA
Comprehensive Climate Change Chart of Whitefish Mountain, USA: Monthly Averages and Impact Trends
Exploring the changing climate in Whitefish Mountain, USA
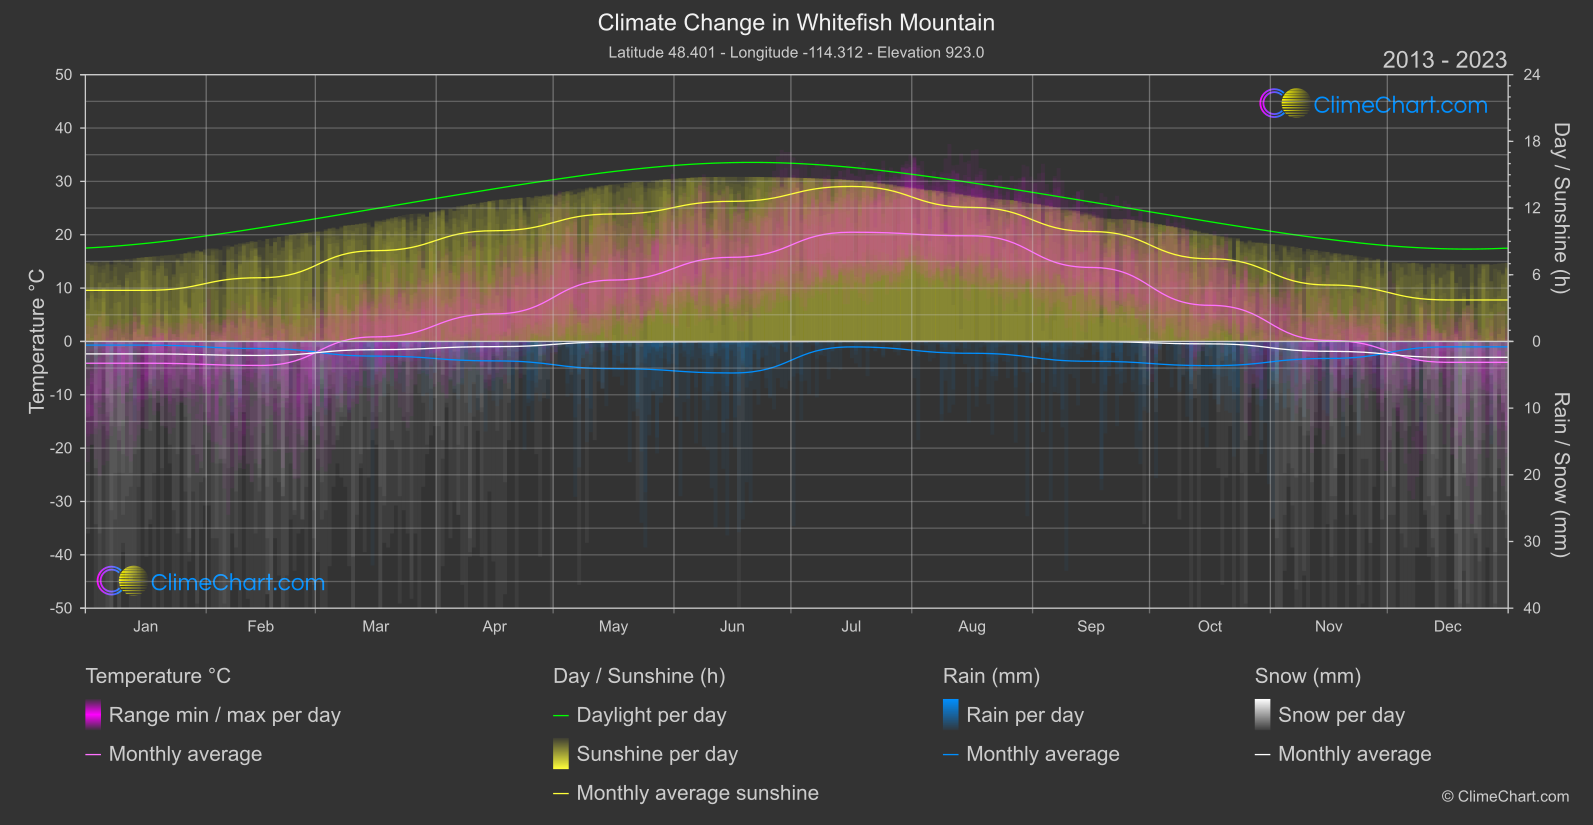
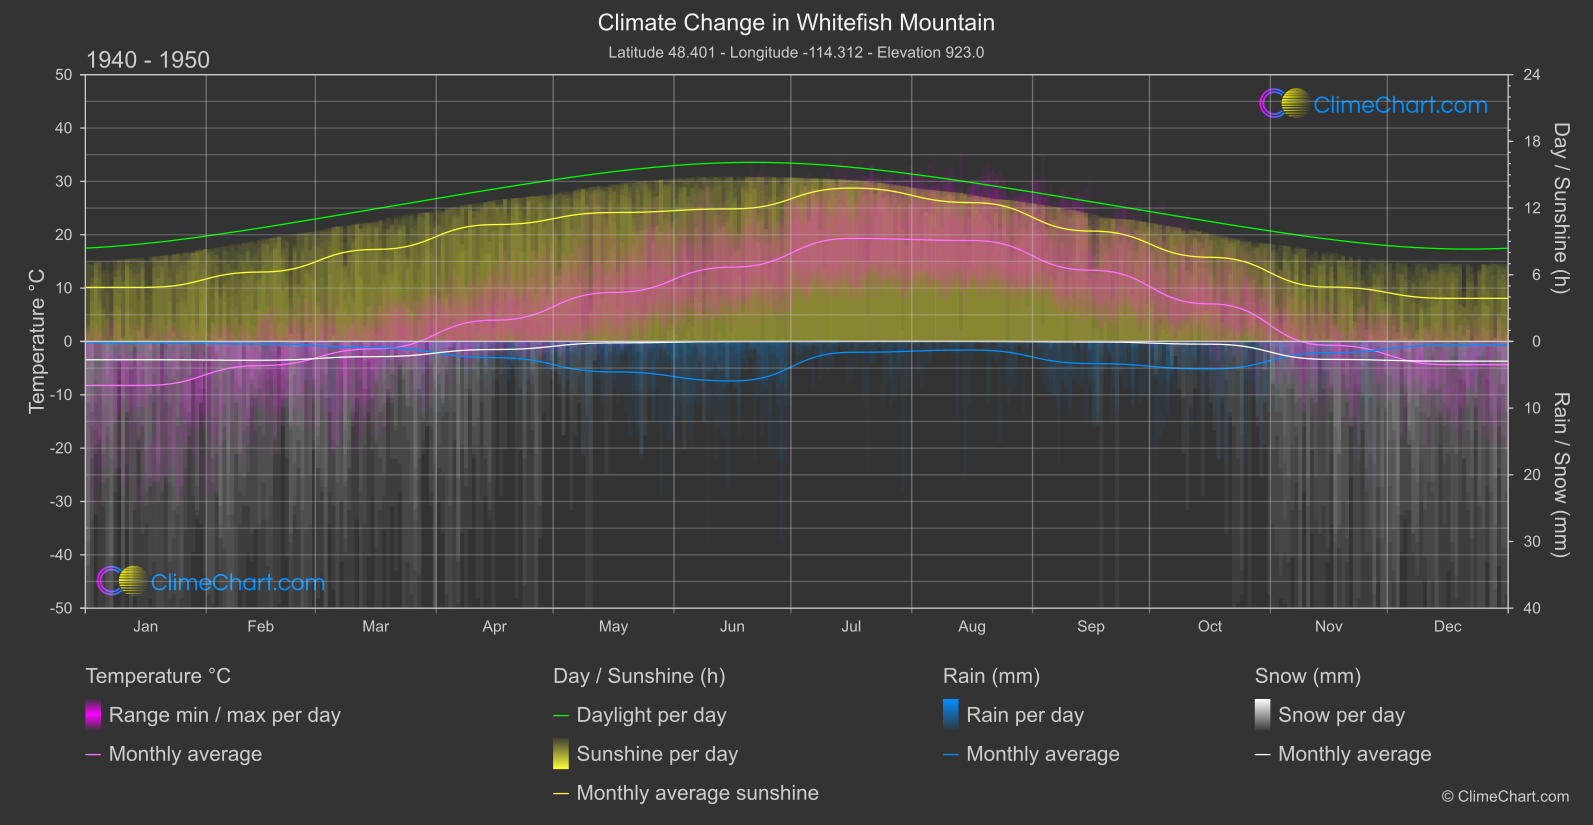
Whitefish Mountain in the United States has experienced significant climate changes over the years. Analyzing temperature, rainfall, snowfall, and sunshine duration data from 1940-1950 to 2013-2024 reveals interesting insights. For instance, the month of May shows a noticeable increase in temperature and a decrease in rainfall. Additionally, June records a rise in sunshine duration, indicating potential shifts in weather patterns.
Climate Change Data Overview for Whitefish Mountain, USA
Explore the comprehensive climate change data for Whitefish Mountain, USA. This detailed table provides valuable insights into temperature variations, precipitation levels, and seasonal changes influenced by climate change, helping you understand the unique weather patterns of this region.
Temperature °C
| Month | ⌀ 1940 - 1950 | ⌀ 2013 - 2023 | +/- |
|---|---|---|---|
| Jan | -8.24 | -4.09 | 4.15 |
| Feb | -4.53 | -4.50 | 0.03 |
| Mar | -1.37 | 0.85 | 2.22 |
| Apr | 3.98 | 5.17 | 1.18 |
| May | 9.19 | 11.50 | 2.32 |
| Jun | 13.93 | 15.77 | 1.85 |
| Jul | 19.31 | 20.47 | 1.16 |
| Aug | 18.92 | 19.80 | 0.89 |
| Sep | 13.34 | 13.87 | 0.52 |
| Oct | 7.03 | 6.77 | -0.27 |
| Nov | -0.72 | 0.18 | 0.89 |
| Dec | -4.36 | -3.92 | 0.44 |
| ⌀ Month | 5.54 | 6.82 | 1.28 |
Sunshine (h)
| Month | ⌀ 1940 - 1950 | ⌀ 2013 - 2023 | +/- |
|---|---|---|---|
| Jan | 4.86 | 4.60 | -0.26 |
| Feb | 6.24 | 5.73 | -0.51 |
| Mar | 8.28 | 8.17 | -0.11 |
| Apr | 10.51 | 9.96 | -0.55 |
| May | 11.60 | 11.47 | -0.13 |
| Jun | 11.93 | 12.61 | 0.68 |
| Jul | 13.80 | 13.94 | 0.15 |
| Aug | 12.49 | 12.06 | -0.43 |
| Sep | 9.93 | 9.89 | -0.04 |
| Oct | 7.57 | 7.44 | -0.13 |
| Nov | 4.89 | 5.08 | 0.19 |
| Dec | 3.87 | 3.73 | -0.14 |
| ⌀ Month | 8.83 | 8.72 | -0.11 |
Rain (mm)
| Month | ⌀ 1940 - 1950 | ⌀ 2013 - 2023 | +/- |
|---|---|---|---|
| Jan | 0.10 | 0.28 | 0.17 |
| Feb | 0.19 | 0.53 | 0.35 |
| Mar | 0.46 | 1.10 | 0.64 |
| Apr | 1.22 | 1.46 | 0.24 |
| May | 2.28 | 2.04 | -0.25 |
| Jun | 2.96 | 2.37 | -0.60 |
| Jul | 0.82 | 0.41 | -0.40 |
| Aug | 0.64 | 0.89 | 0.25 |
| Sep | 1.66 | 1.49 | -0.17 |
| Oct | 2.06 | 1.81 | -0.25 |
| Nov | 0.85 | 1.28 | 0.43 |
| Dec | 0.28 | 0.41 | 0.13 |
| ⌀ Month | 1.13 | 1.17 | 0.04 |
Snow (mm)
| Month | ⌀ 1940 - 1950 | ⌀ 2013 - 2023 | +/- |
|---|---|---|---|
| Jan | 1.37 | 0.93 | -0.44 |
| Feb | 1.41 | 1.05 | -0.36 |
| Mar | 1.14 | 0.62 | -0.52 |
| Apr | 0.61 | 0.39 | -0.21 |
| May | 0.11 | 0.05 | -0.06 |
| Jun | 0.01 | 0.02 | 0.01 |
| Jul | 0.00 | 0.00 | 0.00 |
| Aug | 0.00 | 0.00 | 0.00 |
| Sep | 0.04 | 0.01 | -0.03 |
| Oct | 0.20 | 0.18 | -0.02 |
| Nov | 1.35 | 0.74 | -0.61 |
| Dec | 1.48 | 1.19 | -0.29 |
| ⌀ Month | 0.64 | 0.43 | -0.21 |