Climate Change Chart of Voronezh, Russian Federation
Comprehensive Climate Change Chart of Voronezh, Russian Federation: Monthly Averages and Impact Trends
Explore the changing climate in Voronezh, Russian Federation, with insights from temperature, rainfall, snowfall, and sunshine duration data. Discover how climate patterns have evolved over the years.
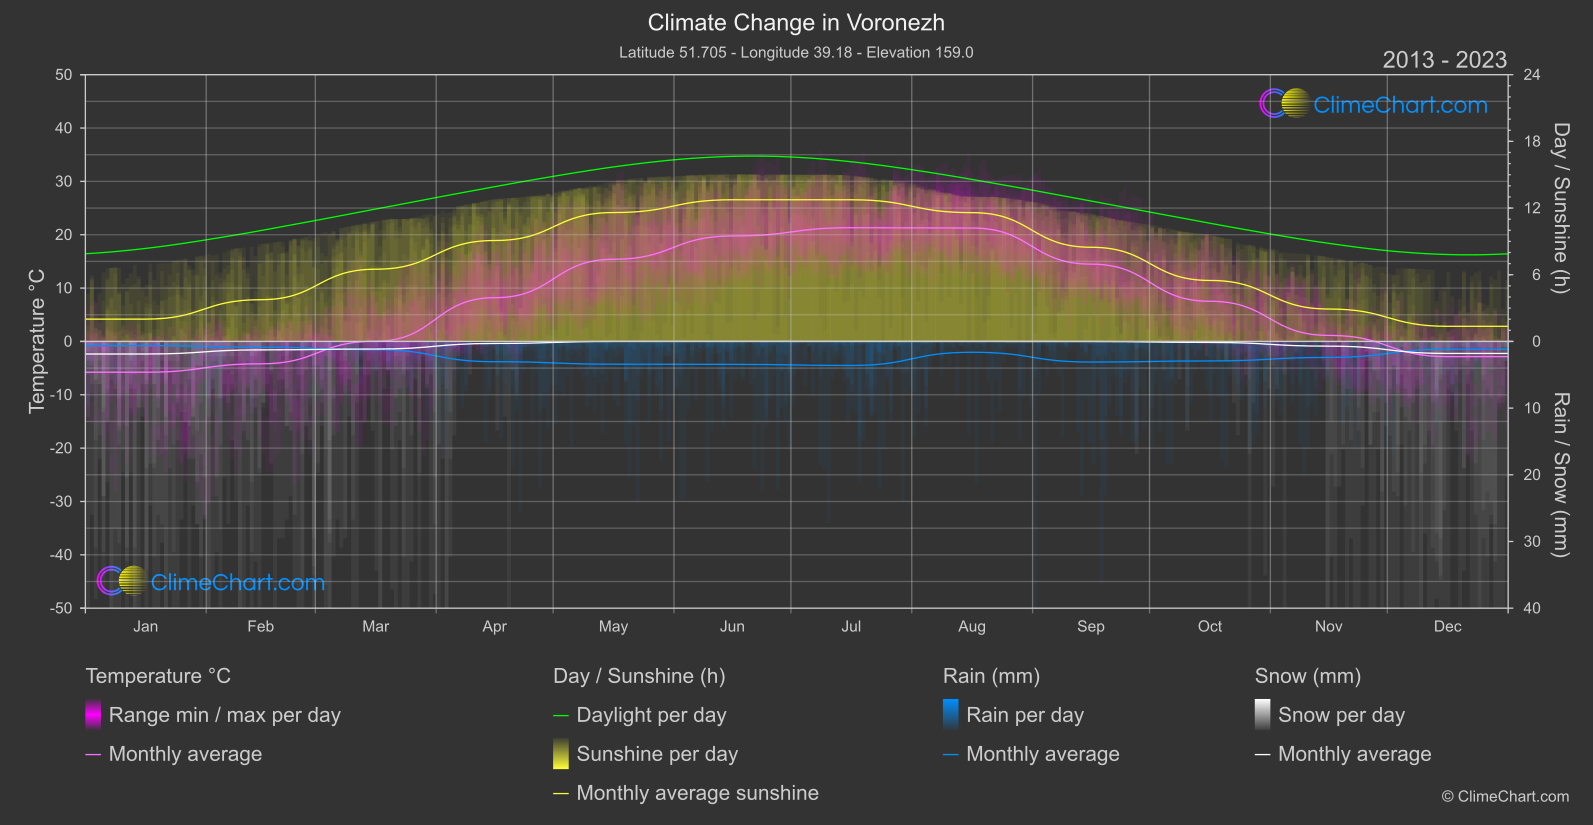
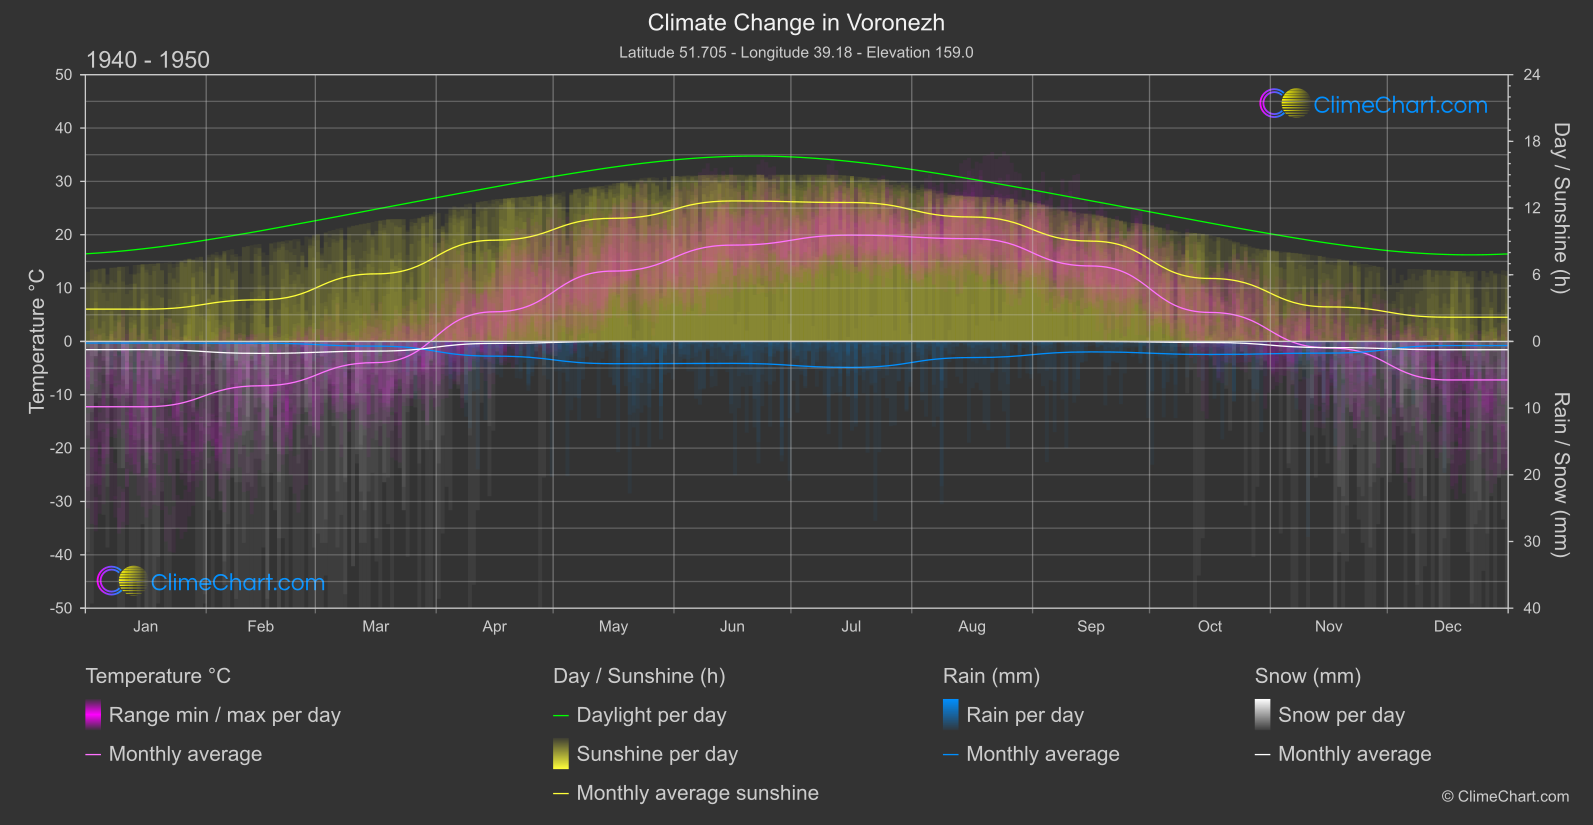
Voronezh, located in the Russian Federation, has experienced notable changes in its climate over the years. The data reveals interesting patterns, such as varying temperature trends, fluctuating rainfall levels, snowfall variations, and changes in sunshine duration. Among the insights, it's noteworthy that the month of March shows a significant temperature increase, while September sees a slight rise in rainfall. Understanding these climate shifts is crucial for adapting to the evolving environmental conditions in Voronezh.
Climate Change Data Overview for Voronezh, Russian Federation
Explore the comprehensive climate change data for Voronezh, Russian Federation. This detailed table provides valuable insights into temperature variations, precipitation levels, and seasonal changes influenced by climate change, helping you understand the unique weather patterns of this region.
Temperature °C
| Month | ⌀ 1940 - 1950 | ⌀ 2013 - 2023 | +/- |
|---|---|---|---|
| Jan | -12.24 | -5.77 | 6.47 |
| Feb | -8.31 | -4.20 | 4.11 |
| Mar | -3.97 | 0.04 | 4.01 |
| Apr | 5.56 | 8.20 | 2.64 |
| May | 13.19 | 15.40 | 2.21 |
| Jun | 18.05 | 19.77 | 1.71 |
| Jul | 19.92 | 21.32 | 1.39 |
| Aug | 19.26 | 21.25 | 1.99 |
| Sep | 14.15 | 14.49 | 0.35 |
| Oct | 5.43 | 7.53 | 2.10 |
| Nov | -1.22 | 1.13 | 2.35 |
| Dec | -7.22 | -2.85 | 4.37 |
| ⌀ Month | 5.22 | 8.03 | 2.81 |
Sunshine (h)
| Month | ⌀ 1940 - 1950 | ⌀ 2013 - 2023 | +/- |
|---|---|---|---|
| Jan | 2.91 | 2.01 | -0.90 |
| Feb | 3.74 | 3.75 | 0.01 |
| Mar | 6.08 | 6.50 | 0.42 |
| Apr | 9.11 | 9.08 | -0.03 |
| May | 11.08 | 11.60 | 0.52 |
| Jun | 12.64 | 12.75 | 0.11 |
| Jul | 12.50 | 12.74 | 0.24 |
| Aug | 11.19 | 11.59 | 0.39 |
| Sep | 9.03 | 8.47 | -0.55 |
| Oct | 5.67 | 5.49 | -0.18 |
| Nov | 3.11 | 2.92 | -0.19 |
| Dec | 2.18 | 1.36 | -0.82 |
| ⌀ Month | 7.44 | 7.35 | -0.08 |
Rain (mm)
| Month | ⌀ 1940 - 1950 | ⌀ 2013 - 2023 | +/- |
|---|---|---|---|
| Jan | 0.12 | 0.31 | 0.19 |
| Feb | 0.13 | 0.43 | 0.30 |
| Mar | 0.35 | 0.62 | 0.27 |
| Apr | 1.10 | 1.52 | 0.42 |
| May | 1.67 | 1.71 | 0.04 |
| Jun | 1.65 | 1.72 | 0.07 |
| Jul | 1.95 | 1.80 | -0.14 |
| Aug | 1.21 | 0.81 | -0.40 |
| Sep | 0.79 | 1.55 | 0.76 |
| Oct | 0.98 | 1.46 | 0.49 |
| Nov | 0.88 | 1.20 | 0.32 |
| Dec | 0.31 | 0.58 | 0.28 |
| ⌀ Month | 0.93 | 1.14 | 0.22 |
Snow (mm)
| Month | ⌀ 1940 - 1950 | ⌀ 2013 - 2023 | +/- |
|---|---|---|---|
| Jan | 0.62 | 0.94 | 0.33 |
| Feb | 0.90 | 0.63 | -0.26 |
| Mar | 0.73 | 0.57 | -0.16 |
| Apr | 0.15 | 0.15 | 0.00 |
| May | 0.00 | 0.00 | 0.00 |
| Jun | 0.00 | 0.00 | 0.00 |
| Jul | 0.00 | 0.00 | 0.00 |
| Aug | 0.00 | 0.00 | 0.00 |
| Sep | 0.00 | 0.01 | 0.01 |
| Oct | 0.08 | 0.08 | -0.01 |
| Nov | 0.46 | 0.35 | -0.11 |
| Dec | 0.62 | 0.90 | 0.28 |
| ⌀ Month | 0.30 | 0.30 | 0.01 |