Climate Change Chart of Volgograd, Russian Federation
Comprehensive Climate Change Chart of Volgograd, Russian Federation: Monthly Averages and Impact Trends
Exploring the changing climate of Volgograd, Russian Federation reveals intriguing patterns in temperature, rainfall, snowfall, and sunshine duration over the years.
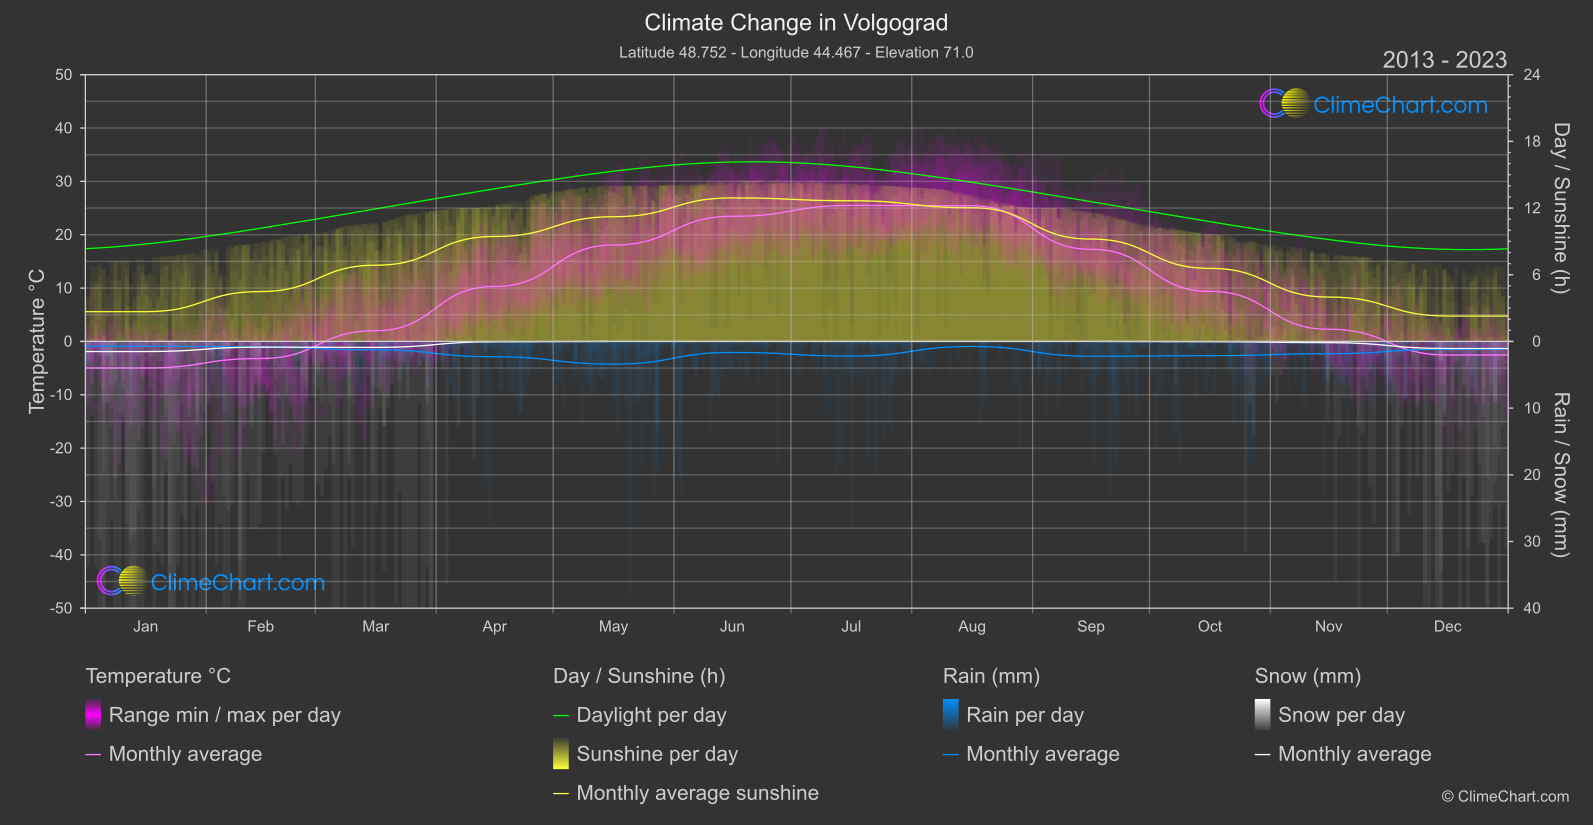
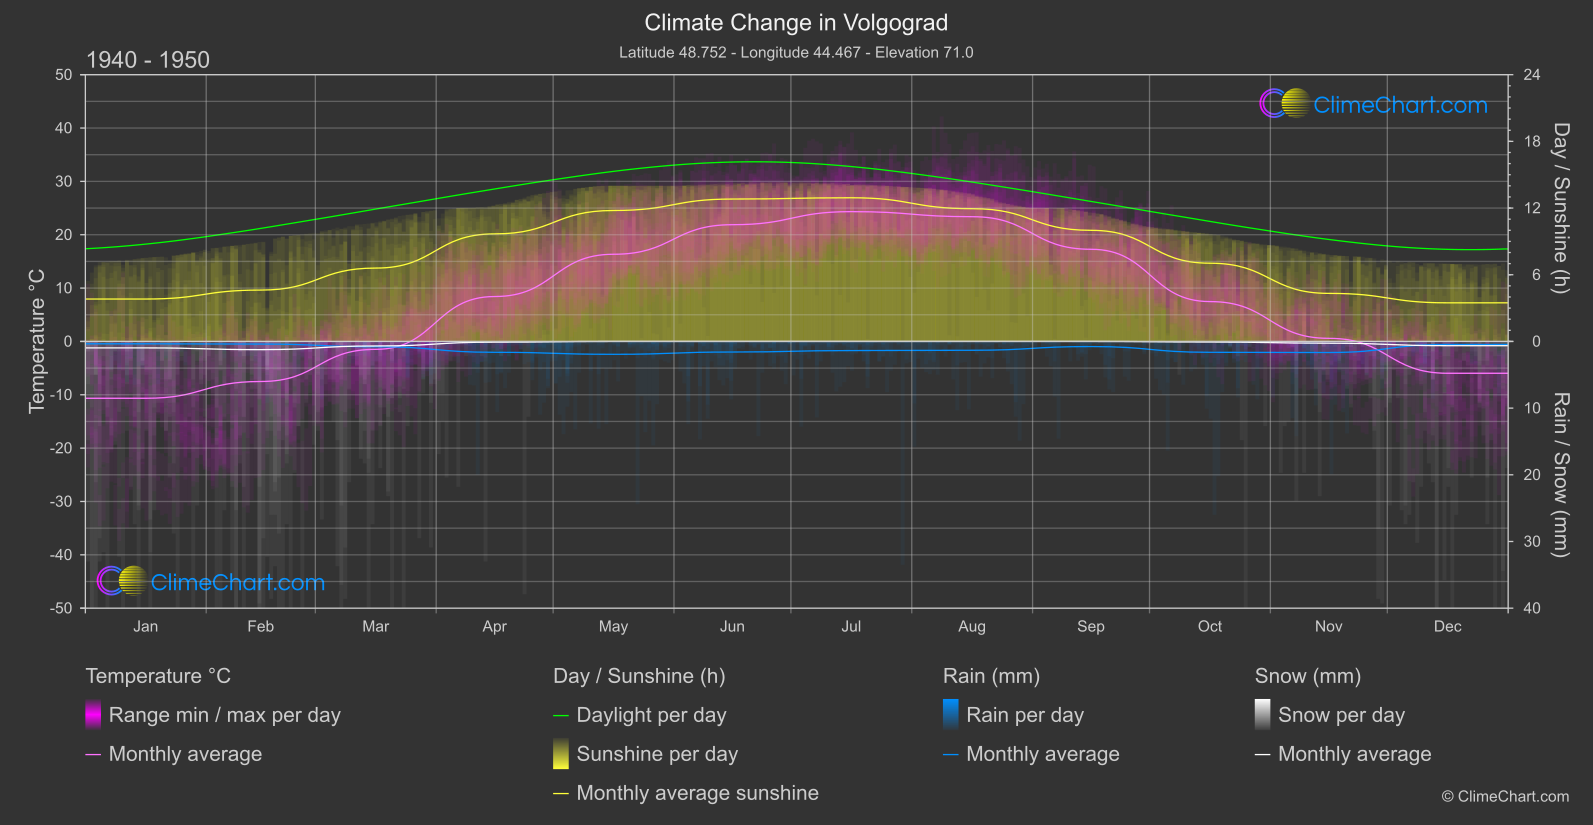
Volgograd, located in the Russian Federation, has experienced noticeable changes in its climate parameters over the years. Analyzing the temperature data, it is evident that the month of March has shown the highest increase in temperature over the decades, with a change of 3.51°C. On the other hand, September has seen a negligible change in temperature. Rainfall patterns also exhibit significant variations, with July experiencing the most notable increase in rainfall compared to past decades. Snowfall and sunshine duration have also fluctuated, showcasing the dynamic nature of Volgograd's climate.
Climate Change Data Overview for Volgograd, Russian Federation
Explore the comprehensive climate change data for Volgograd, Russian Federation. This detailed table provides valuable insights into temperature variations, precipitation levels, and seasonal changes influenced by climate change, helping you understand the unique weather patterns of this region.
Temperature °C
| Month | ⌀ 1940 - 1950 | ⌀ 2013 - 2023 | +/- |
|---|---|---|---|
| Jan | -10.66 | -4.98 | 5.68 |
| Feb | -7.51 | -3.20 | 4.31 |
| Mar | -1.48 | 2.02 | 3.51 |
| Apr | 8.42 | 10.30 | 1.89 |
| May | 16.34 | 18.07 | 1.73 |
| Jun | 21.88 | 23.45 | 1.57 |
| Jul | 24.33 | 25.50 | 1.17 |
| Aug | 23.38 | 25.43 | 2.05 |
| Sep | 17.27 | 17.27 | -0.00 |
| Oct | 7.47 | 9.38 | 1.91 |
| Nov | 0.58 | 2.28 | 1.70 |
| Dec | -5.97 | -2.55 | 3.42 |
| ⌀ Month | 7.84 | 10.25 | 2.41 |
Sunshine (h)
| Month | ⌀ 1940 - 1950 | ⌀ 2013 - 2023 | +/- |
|---|---|---|---|
| Jan | 3.81 | 2.68 | -1.14 |
| Feb | 4.62 | 4.49 | -0.13 |
| Mar | 6.60 | 6.86 | 0.26 |
| Apr | 9.68 | 9.44 | -0.23 |
| May | 11.78 | 11.22 | -0.56 |
| Jun | 12.81 | 12.91 | 0.10 |
| Jul | 12.93 | 12.66 | -0.27 |
| Aug | 11.94 | 12.02 | 0.08 |
| Sep | 10.00 | 9.21 | -0.79 |
| Oct | 7.04 | 6.57 | -0.46 |
| Nov | 4.32 | 3.99 | -0.33 |
| Dec | 3.47 | 2.29 | -1.19 |
| ⌀ Month | 8.25 | 7.86 | -0.39 |
Rain (mm)
| Month | ⌀ 1940 - 1950 | ⌀ 2013 - 2023 | +/- |
|---|---|---|---|
| Jan | 0.18 | 0.36 | 0.18 |
| Feb | 0.20 | 0.41 | 0.21 |
| Mar | 0.40 | 0.63 | 0.23 |
| Apr | 0.81 | 1.15 | 0.33 |
| May | 0.97 | 1.70 | 0.73 |
| Jun | 0.79 | 0.83 | 0.03 |
| Jul | 0.68 | 1.10 | 0.41 |
| Aug | 0.66 | 0.38 | -0.28 |
| Sep | 0.38 | 1.11 | 0.73 |
| Oct | 0.82 | 1.07 | 0.25 |
| Nov | 0.83 | 0.92 | 0.09 |
| Dec | 0.23 | 0.58 | 0.35 |
| ⌀ Month | 0.58 | 0.85 | 0.27 |
Snow (mm)
| Month | ⌀ 1940 - 1950 | ⌀ 2013 - 2023 | +/- |
|---|---|---|---|
| Jan | 0.49 | 0.76 | 0.27 |
| Feb | 0.61 | 0.43 | -0.19 |
| Mar | 0.34 | 0.45 | 0.11 |
| Apr | 0.05 | 0.03 | -0.03 |
| May | 0.00 | 0.00 | 0.00 |
| Jun | 0.00 | 0.00 | 0.00 |
| Jul | 0.00 | 0.00 | 0.00 |
| Aug | 0.00 | 0.00 | 0.00 |
| Sep | 0.00 | 0.00 | 0.00 |
| Oct | 0.04 | 0.02 | -0.03 |
| Nov | 0.13 | 0.09 | -0.04 |
| Dec | 0.32 | 0.53 | 0.21 |
| ⌀ Month | 0.17 | 0.19 | 0.03 |