Climate Change Chart of Vladivostok (Sibiria), Russian Federation
Comprehensive Climate Change Chart of Vladivostok (Sibiria), Russian Federation: Monthly Averages and Impact Trends
Explore the changing climate in Vladivostok, Siberia, Russian Federation with insightful data analysis.
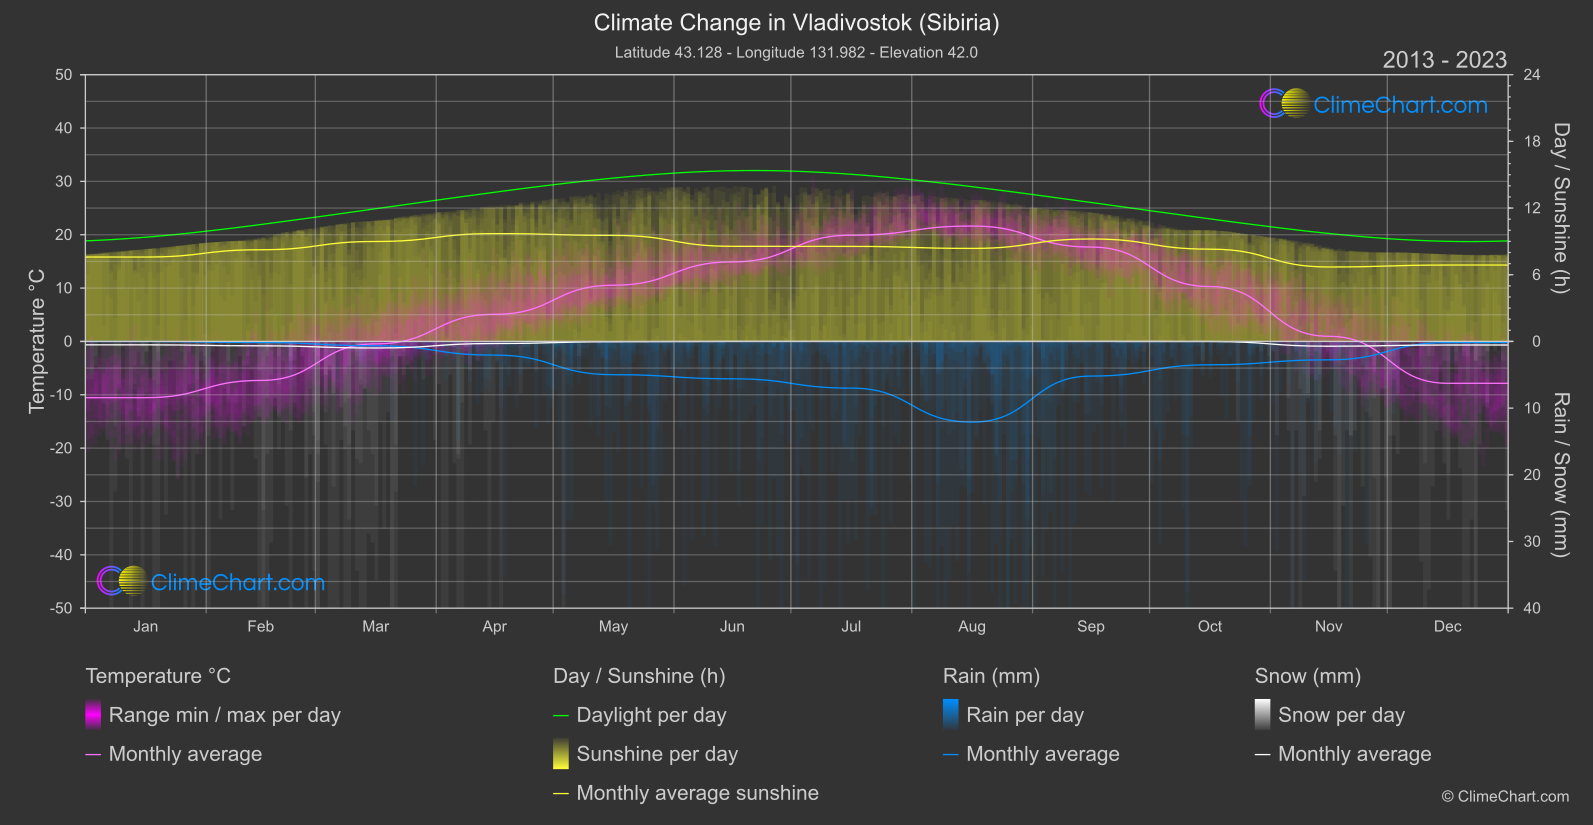
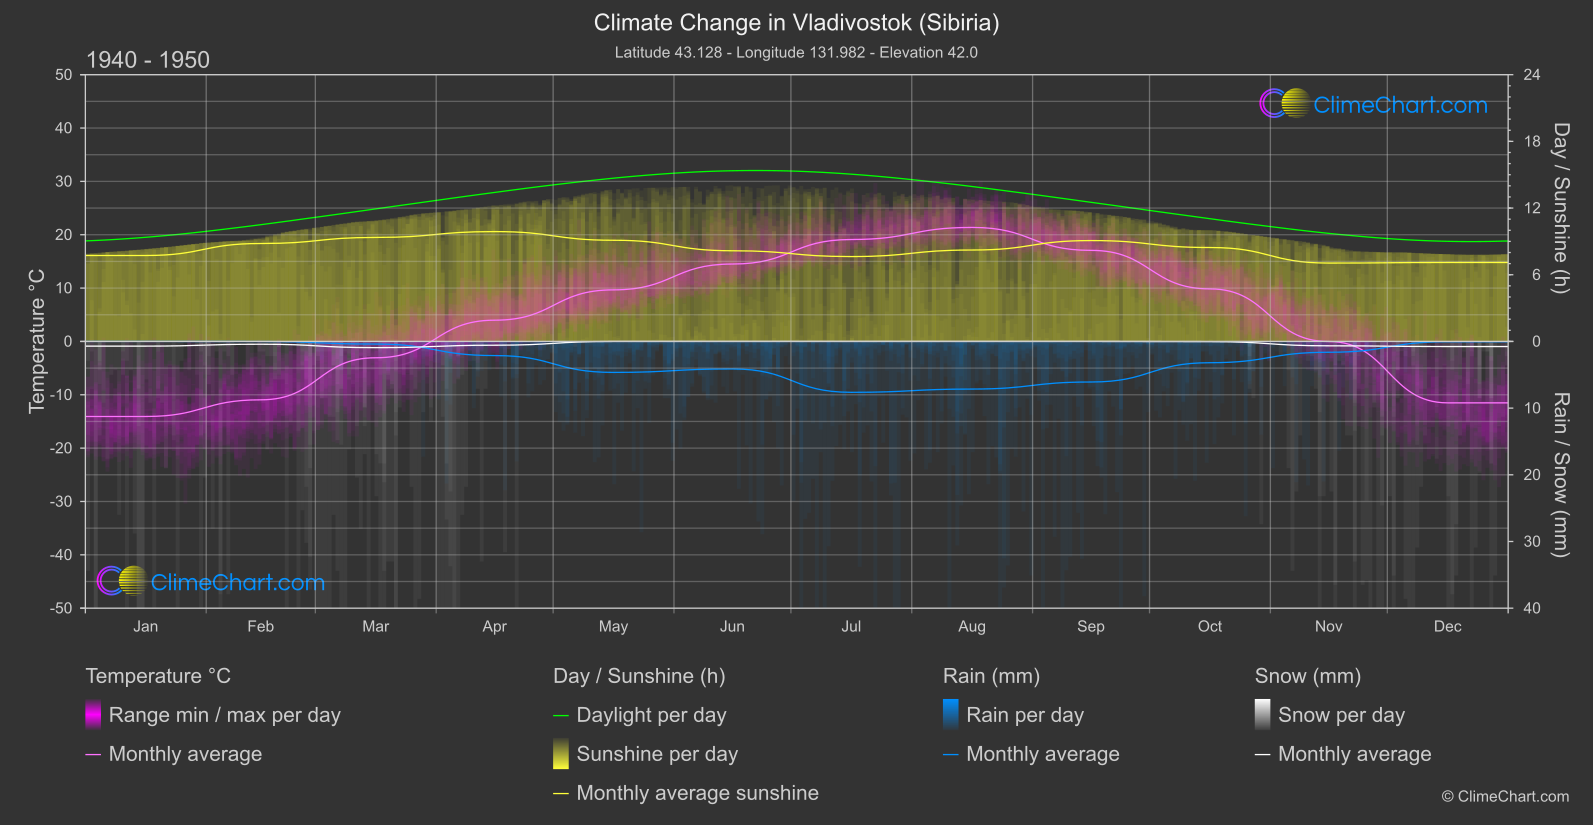
Vladivostok, located in Siberia, Russian Federation, experiences notable changes in temperature, rainfall, snowfall, and sunshine duration. Analyzing the data from the 1940s-1950s compared to 2013-2024 provides insights like the month with the highest temperature change or rainfall variation.
Climate Change Data Overview for Vladivostok (Sibiria), Russian Federation
Explore the comprehensive climate change data for Vladivostok (Sibiria), Russian Federation. This detailed table provides valuable insights into temperature variations, precipitation levels, and seasonal changes influenced by climate change, helping you understand the unique weather patterns of this region.
Temperature °C
| Month | ⌀ 1940 - 1950 | ⌀ 2013 - 2023 | +/- |
|---|---|---|---|
| Jan | -14.07 | -10.54 | 3.52 |
| Feb | -10.95 | -7.31 | 3.64 |
| Mar | -3.06 | -0.45 | 2.61 |
| Apr | 3.98 | 5.08 | 1.10 |
| May | 9.67 | 10.54 | 0.87 |
| Jun | 14.51 | 14.91 | 0.40 |
| Jul | 19.10 | 19.91 | 0.80 |
| Aug | 21.37 | 21.63 | 0.26 |
| Sep | 17.07 | 17.69 | 0.62 |
| Oct | 9.85 | 10.29 | 0.45 |
| Nov | -0.02 | 0.96 | 0.98 |
| Dec | -11.51 | -7.85 | 3.67 |
| ⌀ Month | 4.66 | 6.24 | 1.58 |
Sunshine (h)
| Month | ⌀ 1940 - 1950 | ⌀ 2013 - 2023 | +/- |
|---|---|---|---|
| Jan | 7.73 | 7.59 | -0.14 |
| Feb | 8.81 | 8.25 | -0.56 |
| Mar | 9.36 | 8.99 | -0.36 |
| Apr | 9.88 | 9.70 | -0.18 |
| May | 9.10 | 9.54 | 0.44 |
| Jun | 8.16 | 8.56 | 0.40 |
| Jul | 7.64 | 8.55 | 0.91 |
| Aug | 8.22 | 8.37 | 0.14 |
| Sep | 9.07 | 9.22 | 0.14 |
| Oct | 8.45 | 8.30 | -0.15 |
| Nov | 7.05 | 6.70 | -0.35 |
| Dec | 7.10 | 6.87 | -0.23 |
| ⌀ Month | 8.38 | 8.39 | 0.01 |
Rain (mm)
| Month | ⌀ 1940 - 1950 | ⌀ 2013 - 2023 | +/- |
|---|---|---|---|
| Jan | 0.00 | 0.00 | 0.00 |
| Feb | 0.00 | 0.08 | 0.08 |
| Mar | 0.20 | 0.33 | 0.13 |
| Apr | 1.06 | 1.03 | -0.03 |
| May | 2.32 | 2.49 | 0.17 |
| Jun | 2.06 | 2.80 | 0.74 |
| Jul | 3.82 | 3.50 | -0.32 |
| Aug | 3.57 | 6.05 | 2.48 |
| Sep | 3.04 | 2.60 | -0.44 |
| Oct | 1.60 | 1.75 | 0.16 |
| Nov | 0.81 | 1.38 | 0.57 |
| Dec | 0.02 | 0.09 | 0.06 |
| ⌀ Month | 1.54 | 1.84 | 0.30 |
Snow (mm)
| Month | ⌀ 1940 - 1950 | ⌀ 2013 - 2023 | +/- |
|---|---|---|---|
| Jan | 0.35 | 0.25 | -0.10 |
| Feb | 0.21 | 0.33 | 0.12 |
| Mar | 0.47 | 0.49 | 0.03 |
| Apr | 0.28 | 0.16 | -0.13 |
| May | 0.00 | 0.02 | 0.02 |
| Jun | 0.00 | 0.00 | 0.00 |
| Jul | 0.00 | 0.00 | 0.00 |
| Aug | 0.00 | 0.00 | 0.00 |
| Sep | 0.00 | 0.00 | 0.00 |
| Oct | 0.01 | 0.01 | -0.01 |
| Nov | 0.33 | 0.36 | 0.03 |
| Dec | 0.38 | 0.27 | -0.12 |
| ⌀ Month | 0.17 | 0.16 | -0.01 |