Climate Change Chart of Vilnius, Lithuania
Comprehensive Climate Change Chart of Vilnius, Lithuania: Monthly Averages and Impact Trends
Explore the changing climate in Vilnius, Lithuania with insights from temperature, rainfall, snowfall, and sunshine duration data.
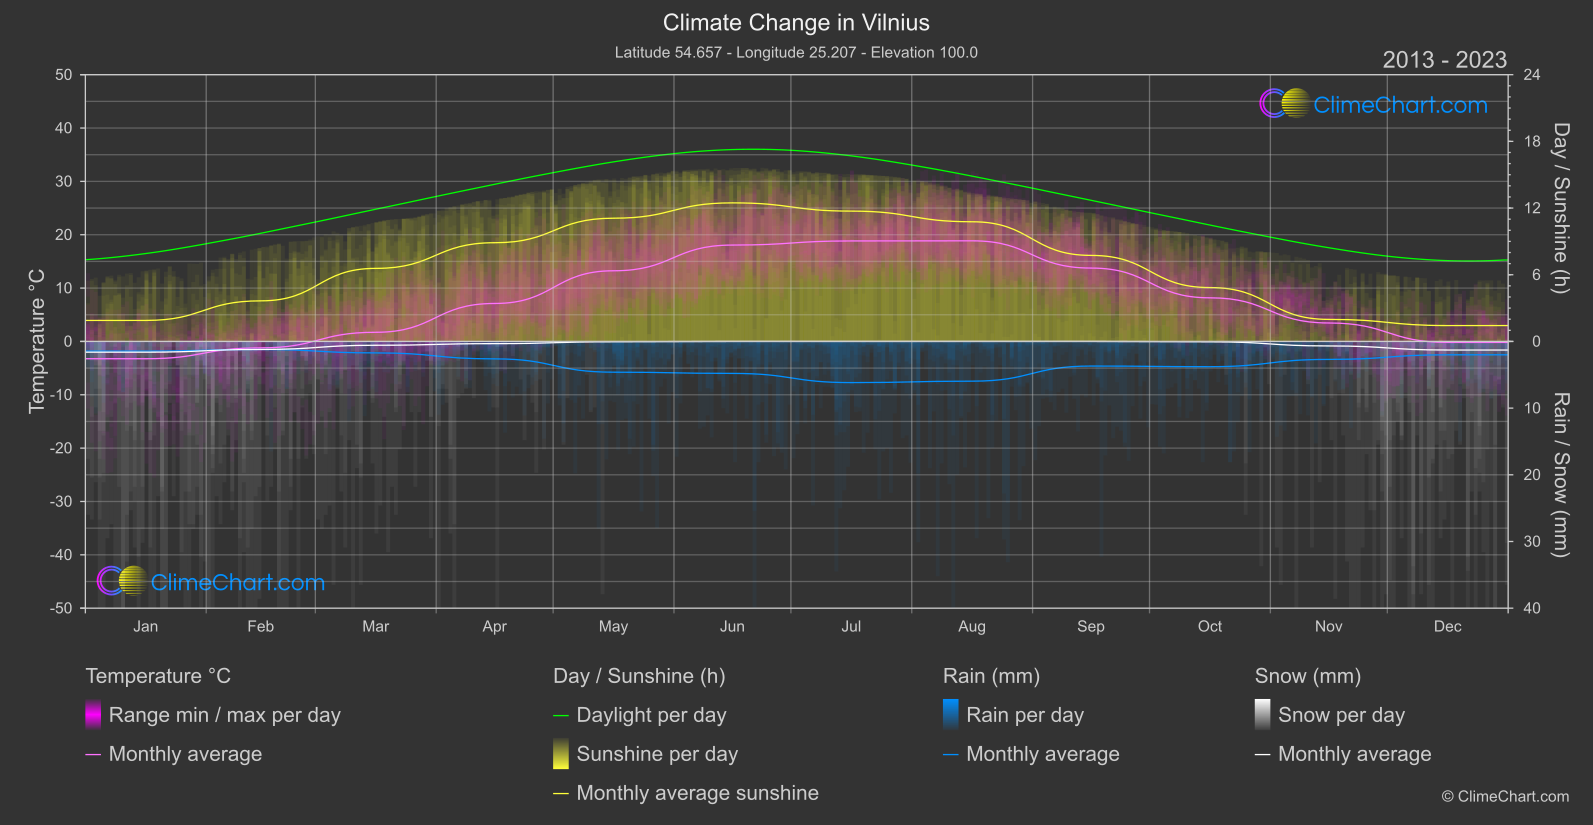
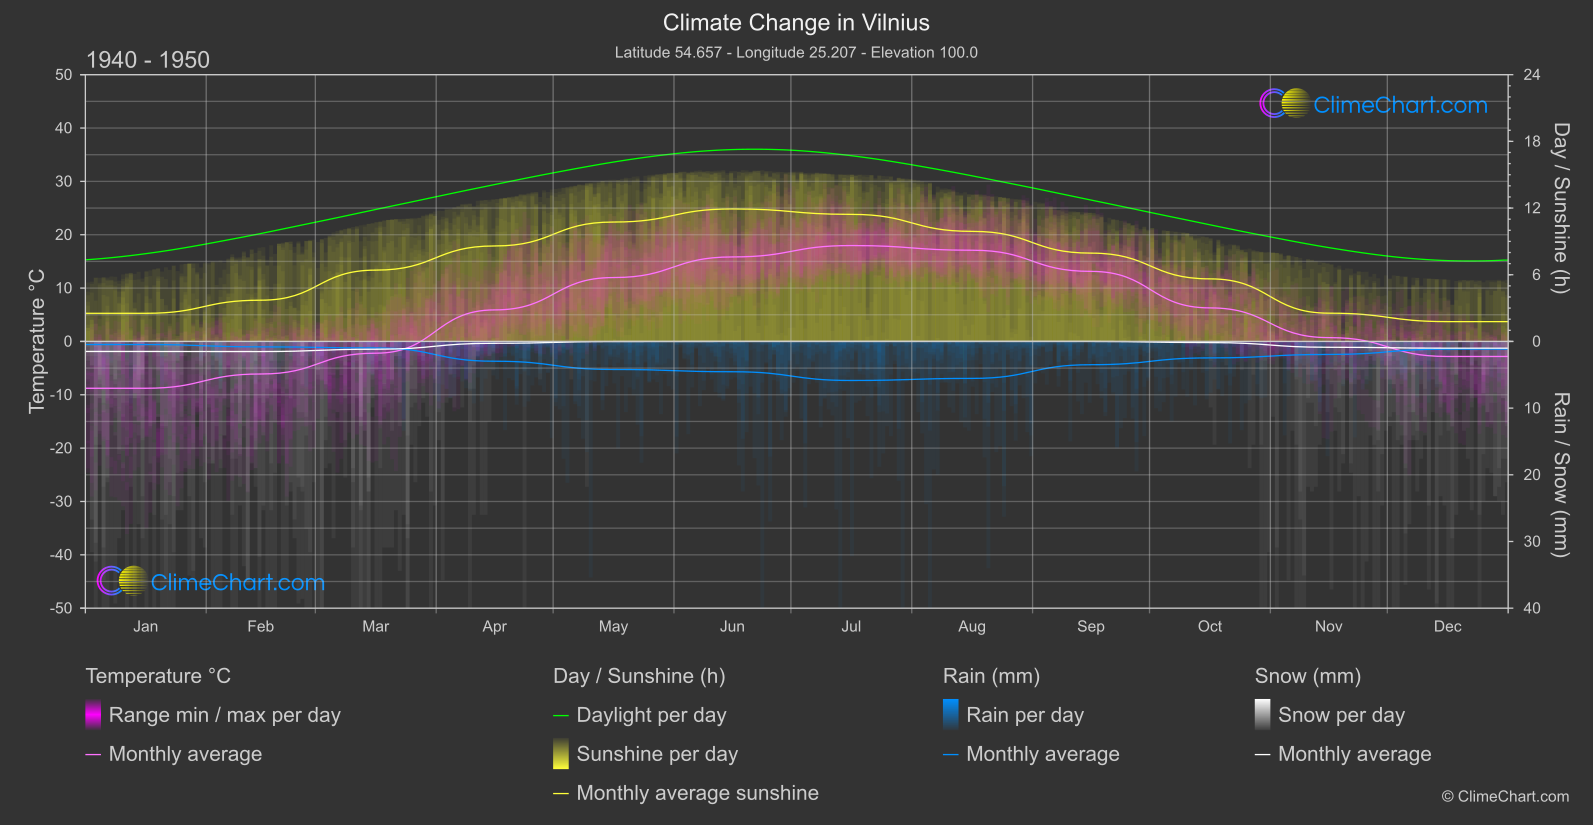
Vilnius, Lithuania, experiences notable changes in climate indicators from 1940-1950 to 2013-2024. The data shows varied shifts in temperature, rainfall, snowfall, and sunshine duration across the months. For instance, June sees a significant increase in average temperature, while August experiences a rise in sunshine duration. Explore the dynamic climate trends in Vilnius for deeper insights into the impact of climate change.
Climate Change Data Overview for Vilnius, Lithuania
Explore the comprehensive climate change data for Vilnius, Lithuania. This detailed table provides valuable insights into temperature variations, precipitation levels, and seasonal changes influenced by climate change, helping you understand the unique weather patterns of this region.
Temperature °C
| Month | ⌀ 1940 - 1950 | ⌀ 2013 - 2023 | +/- |
|---|---|---|---|
| Jan | -8.78 | -3.24 | 5.53 |
| Feb | -6.10 | -1.20 | 4.90 |
| Mar | -2.20 | 1.71 | 3.92 |
| Apr | 5.91 | 7.11 | 1.21 |
| May | 11.97 | 13.24 | 1.27 |
| Jun | 15.84 | 18.06 | 2.23 |
| Jul | 17.97 | 18.84 | 0.86 |
| Aug | 17.09 | 18.86 | 1.76 |
| Sep | 13.13 | 13.75 | 0.62 |
| Oct | 6.29 | 8.18 | 1.89 |
| Nov | 0.72 | 3.46 | 2.74 |
| Dec | -2.82 | -0.18 | 2.64 |
| ⌀ Month | 5.75 | 8.22 | 2.46 |
Sunshine (h)
| Month | ⌀ 1940 - 1950 | ⌀ 2013 - 2023 | +/- |
|---|---|---|---|
| Jan | 2.53 | 1.89 | -0.64 |
| Feb | 3.71 | 3.65 | -0.06 |
| Mar | 6.42 | 6.57 | 0.16 |
| Apr | 8.59 | 8.88 | 0.29 |
| May | 10.74 | 11.09 | 0.34 |
| Jun | 11.92 | 12.47 | 0.55 |
| Jul | 11.43 | 11.73 | 0.29 |
| Aug | 9.90 | 10.77 | 0.86 |
| Sep | 7.95 | 7.74 | -0.21 |
| Oct | 5.63 | 4.85 | -0.78 |
| Nov | 2.54 | 1.98 | -0.56 |
| Dec | 1.78 | 1.43 | -0.36 |
| ⌀ Month | 6.93 | 6.92 | -0.01 |
Rain (mm)
| Month | ⌀ 1940 - 1950 | ⌀ 2013 - 2023 | +/- |
|---|---|---|---|
| Jan | 0.23 | 0.73 | 0.49 |
| Feb | 0.41 | 0.61 | 0.20 |
| Mar | 0.49 | 0.86 | 0.37 |
| Apr | 1.48 | 1.31 | -0.18 |
| May | 2.10 | 2.31 | 0.20 |
| Jun | 2.27 | 2.40 | 0.12 |
| Jul | 2.93 | 3.09 | 0.16 |
| Aug | 2.77 | 2.98 | 0.21 |
| Sep | 1.75 | 1.85 | 0.10 |
| Oct | 1.23 | 1.89 | 0.66 |
| Nov | 0.98 | 1.35 | 0.37 |
| Dec | 0.57 | 1.00 | 0.43 |
| ⌀ Month | 1.43 | 1.70 | 0.26 |
Snow (mm)
| Month | ⌀ 1940 - 1950 | ⌀ 2013 - 2023 | +/- |
|---|---|---|---|
| Jan | 0.75 | 0.81 | 0.05 |
| Feb | 0.76 | 0.60 | -0.16 |
| Mar | 0.58 | 0.29 | -0.30 |
| Apr | 0.14 | 0.17 | 0.03 |
| May | 0.01 | 0.03 | 0.02 |
| Jun | 0.00 | 0.00 | 0.00 |
| Jul | 0.00 | 0.00 | 0.00 |
| Aug | 0.00 | 0.00 | 0.00 |
| Sep | 0.00 | 0.00 | 0.00 |
| Oct | 0.09 | 0.03 | -0.06 |
| Nov | 0.44 | 0.34 | -0.10 |
| Dec | 0.51 | 0.64 | 0.14 |
| ⌀ Month | 0.27 | 0.24 | -0.03 |