Climate Change Chart of Vienna, Austria
Comprehensive Climate Change Chart of Vienna, Austria: Monthly Averages and Impact Trends
Explore the changing climate in Vienna, Austria, with insightful data analysis. Discover the trends in temperature, rainfall, snowfall, and sunshine duration from 1940 to 1950 compared to 2013 to 2024.
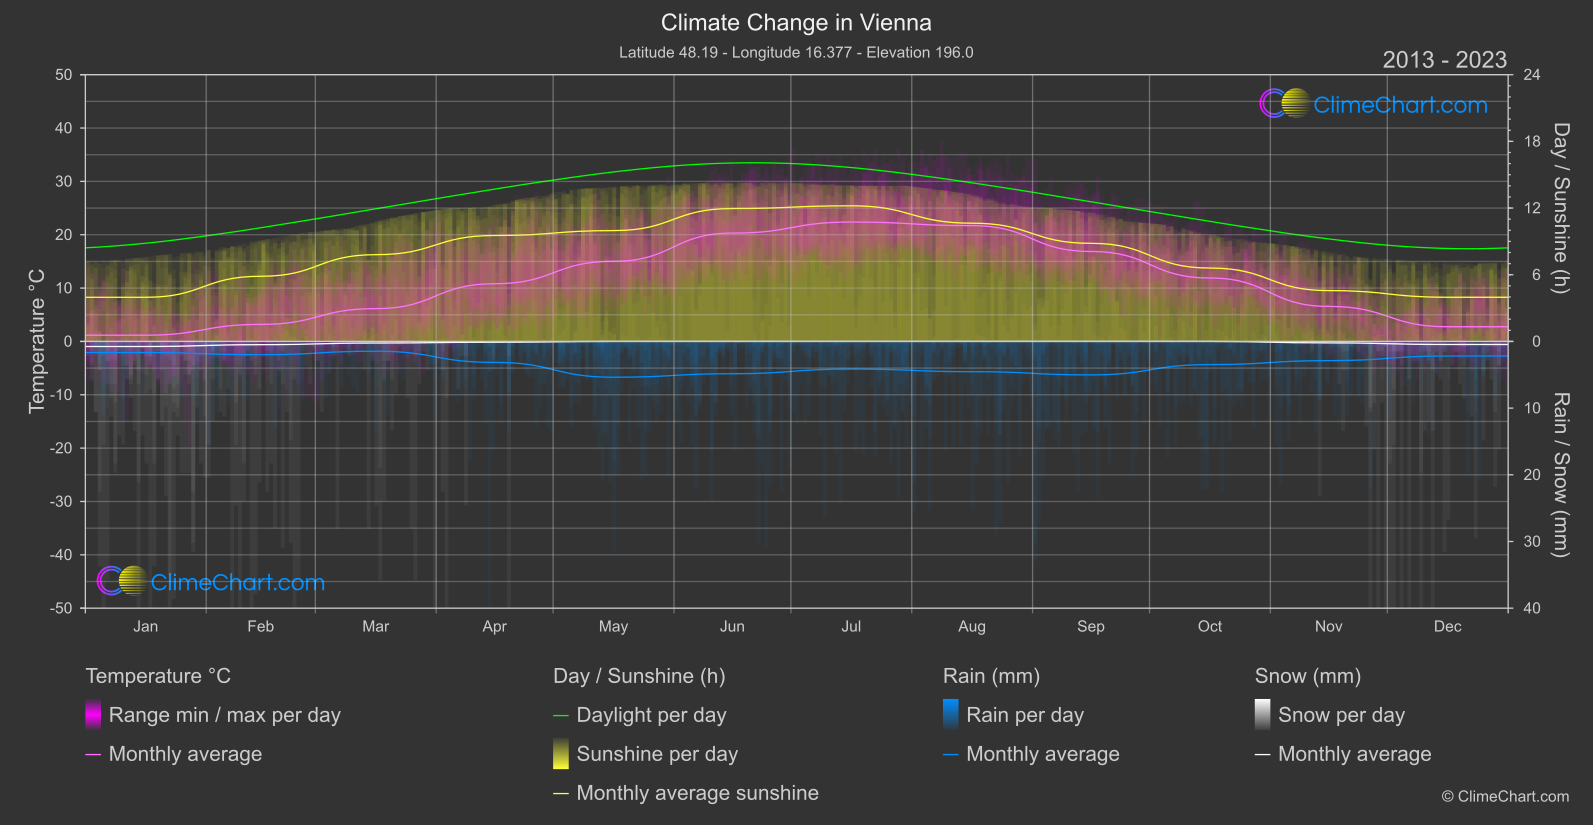
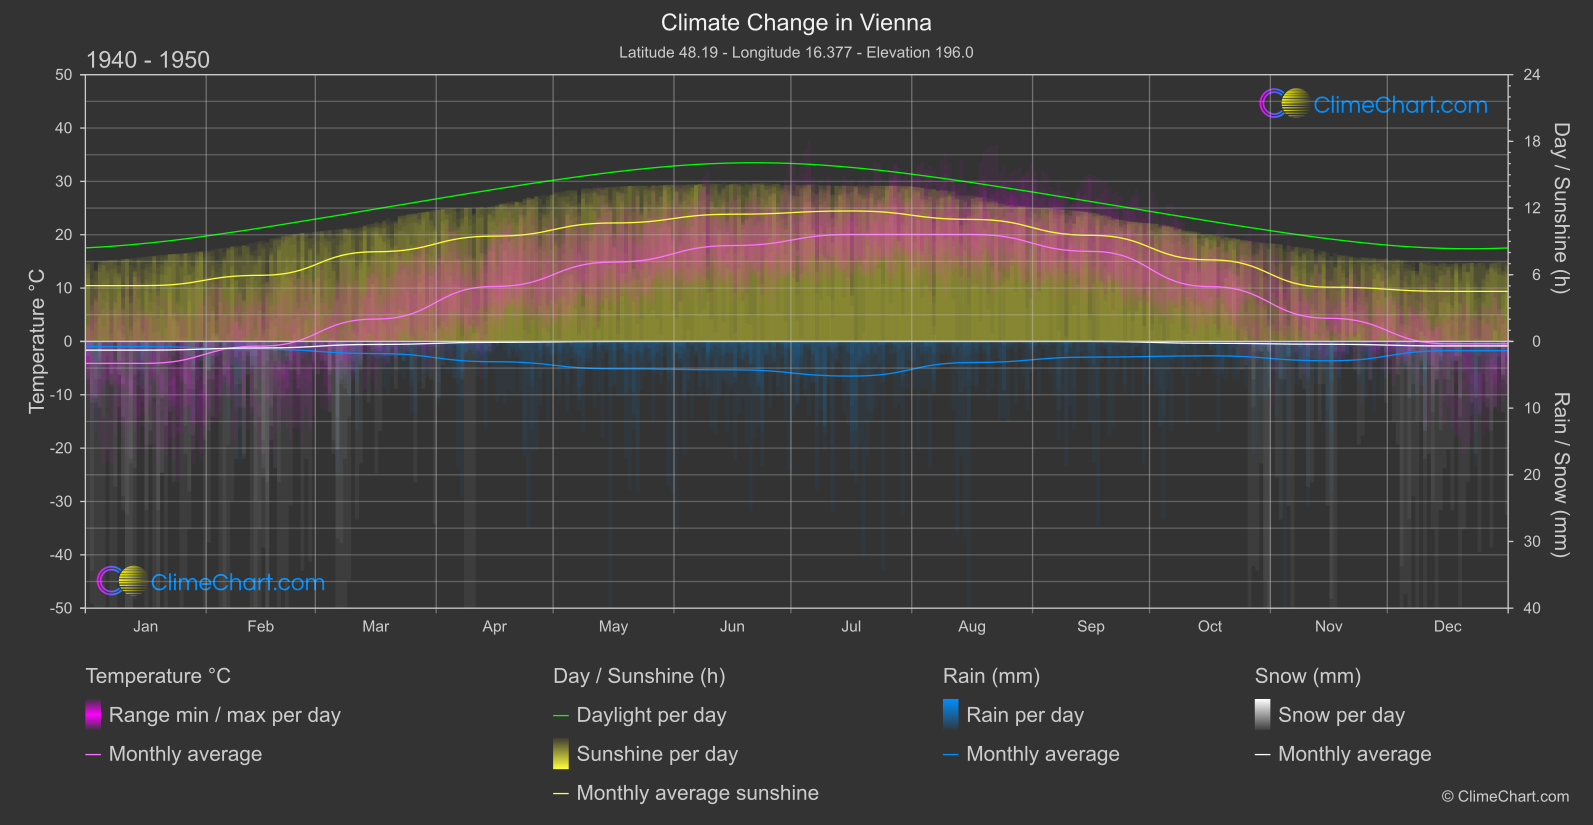
Vienna, the capital of Austria, experiences notable climate changes in temperature, rainfall, snowfall, and sunshine duration. From the data, it can be observed that June experiences the highest increase in temperature, while September sees a decrease. In terms of rainfall, September shows the most significant rise, indicating potential shifts in precipitation patterns. Snowfall has decreased notably across most months, with December displaying the largest reduction. Additionally, sunshine duration has varied, with July and June showcasing the most substantial increases.
Climate Change Data Overview for Vienna, Austria
Explore the comprehensive climate change data for Vienna, Austria. This detailed table provides valuable insights into temperature variations, precipitation levels, and seasonal changes influenced by climate change, helping you understand the unique weather patterns of this region.
Temperature °C
| Month | ⌀ 1940 - 1950 | ⌀ 2013 - 2023 | +/- |
|---|---|---|---|
| Jan | -4.11 | 1.17 | 5.28 |
| Feb | -0.87 | 3.19 | 4.07 |
| Mar | 4.20 | 6.14 | 1.95 |
| Apr | 10.30 | 10.81 | 0.51 |
| May | 14.88 | 15.02 | 0.15 |
| Jun | 17.98 | 20.31 | 2.33 |
| Jul | 20.05 | 22.38 | 2.34 |
| Aug | 20.05 | 21.70 | 1.65 |
| Sep | 16.88 | 16.86 | -0.02 |
| Oct | 10.28 | 11.89 | 1.61 |
| Nov | 4.35 | 6.56 | 2.22 |
| Dec | -0.45 | 2.76 | 3.20 |
| ⌀ Month | 9.46 | 11.57 | 2.11 |
Sunshine (h)
| Month | ⌀ 1940 - 1950 | ⌀ 2013 - 2023 | +/- |
|---|---|---|---|
| Jan | 5.02 | 3.97 | -1.05 |
| Feb | 5.95 | 5.86 | -0.09 |
| Mar | 8.07 | 7.81 | -0.26 |
| Apr | 9.48 | 9.53 | 0.05 |
| May | 10.66 | 9.97 | -0.69 |
| Jun | 11.44 | 11.96 | 0.51 |
| Jul | 11.74 | 12.20 | 0.46 |
| Aug | 10.98 | 10.64 | -0.34 |
| Sep | 9.55 | 8.83 | -0.72 |
| Oct | 7.34 | 6.60 | -0.74 |
| Nov | 4.88 | 4.57 | -0.31 |
| Dec | 4.51 | 3.97 | -0.53 |
| ⌀ Month | 8.30 | 7.99 | -0.31 |
Rain (mm)
| Month | ⌀ 1940 - 1950 | ⌀ 2013 - 2023 | +/- |
|---|---|---|---|
| Jan | 0.40 | 0.84 | 0.44 |
| Feb | 0.59 | 1.00 | 0.41 |
| Mar | 0.91 | 0.73 | -0.18 |
| Apr | 1.52 | 1.57 | 0.05 |
| May | 2.05 | 2.68 | 0.64 |
| Jun | 2.13 | 2.42 | 0.29 |
| Jul | 2.60 | 2.07 | -0.53 |
| Aug | 1.58 | 2.27 | 0.69 |
| Sep | 1.18 | 2.51 | 1.33 |
| Oct | 1.08 | 1.74 | 0.65 |
| Nov | 1.45 | 1.44 | -0.01 |
| Dec | 0.70 | 1.09 | 0.40 |
| ⌀ Month | 1.35 | 1.70 | 0.35 |
Snow (mm)
| Month | ⌀ 1940 - 1950 | ⌀ 2013 - 2023 | +/- |
|---|---|---|---|
| Jan | 0.65 | 0.38 | -0.27 |
| Feb | 0.49 | 0.24 | -0.25 |
| Mar | 0.22 | 0.12 | -0.10 |
| Apr | 0.07 | 0.06 | -0.01 |
| May | 0.00 | 0.00 | 0.00 |
| Jun | 0.00 | 0.00 | 0.00 |
| Jul | 0.00 | 0.00 | 0.00 |
| Aug | 0.00 | 0.00 | 0.00 |
| Sep | 0.00 | 0.00 | 0.00 |
| Oct | 0.14 | 0.00 | -0.14 |
| Nov | 0.21 | 0.11 | -0.11 |
| Dec | 0.34 | 0.23 | -0.11 |
| ⌀ Month | 0.18 | 0.09 | -0.08 |