Climate Change Chart of Valley of Isere, France
Comprehensive Climate Change Chart of Valley of Isere, France: Monthly Averages and Impact Trends
Explore the changing climate in Valley of Isere, France with insightful data analysis. Discover how temperatures, rainfall, snowfall, and sunshine duration have evolved over the years.
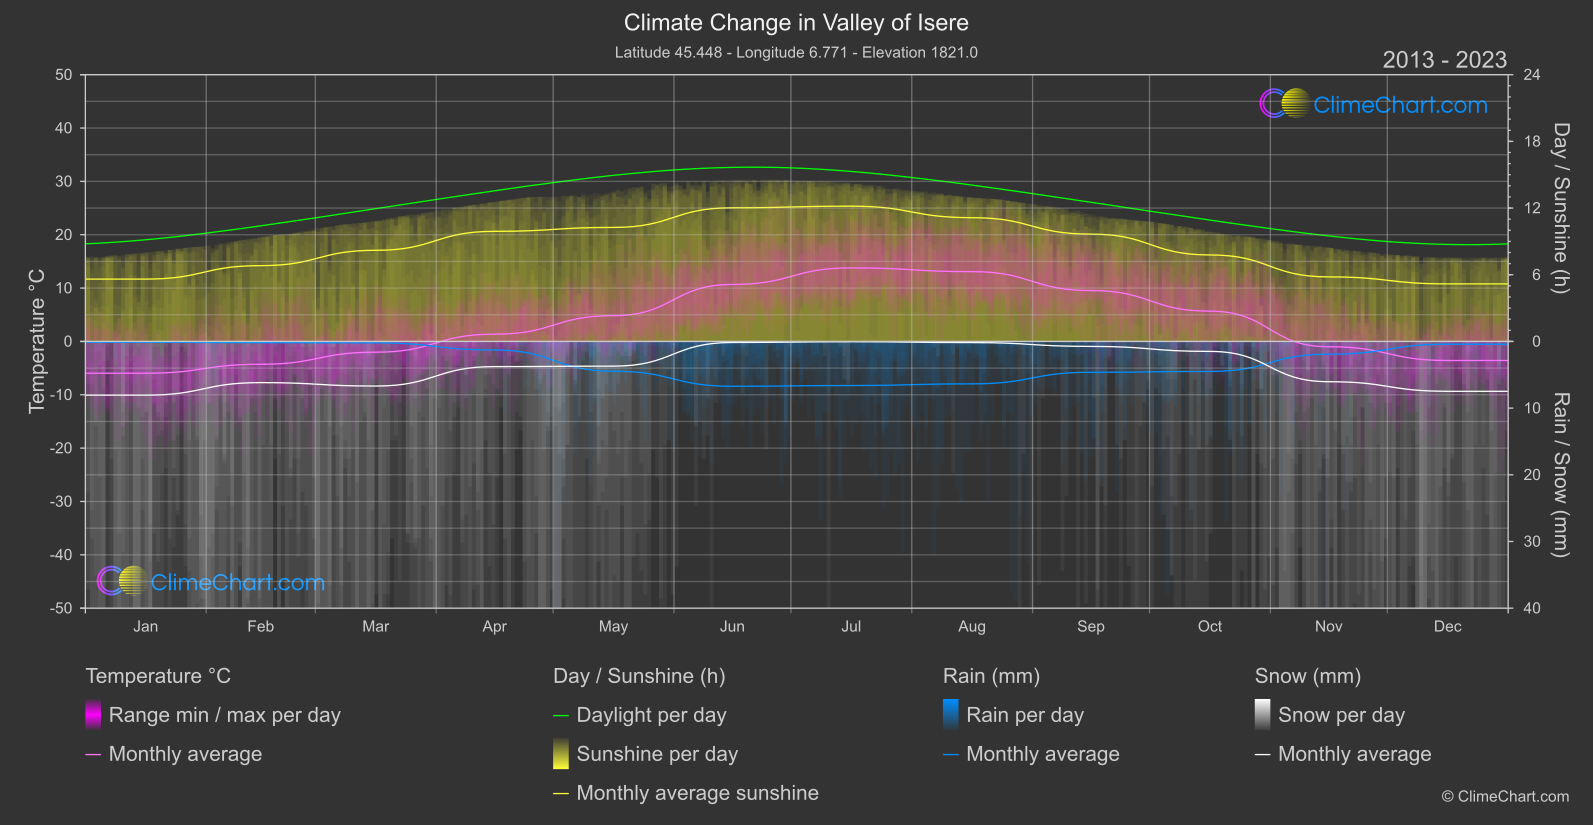
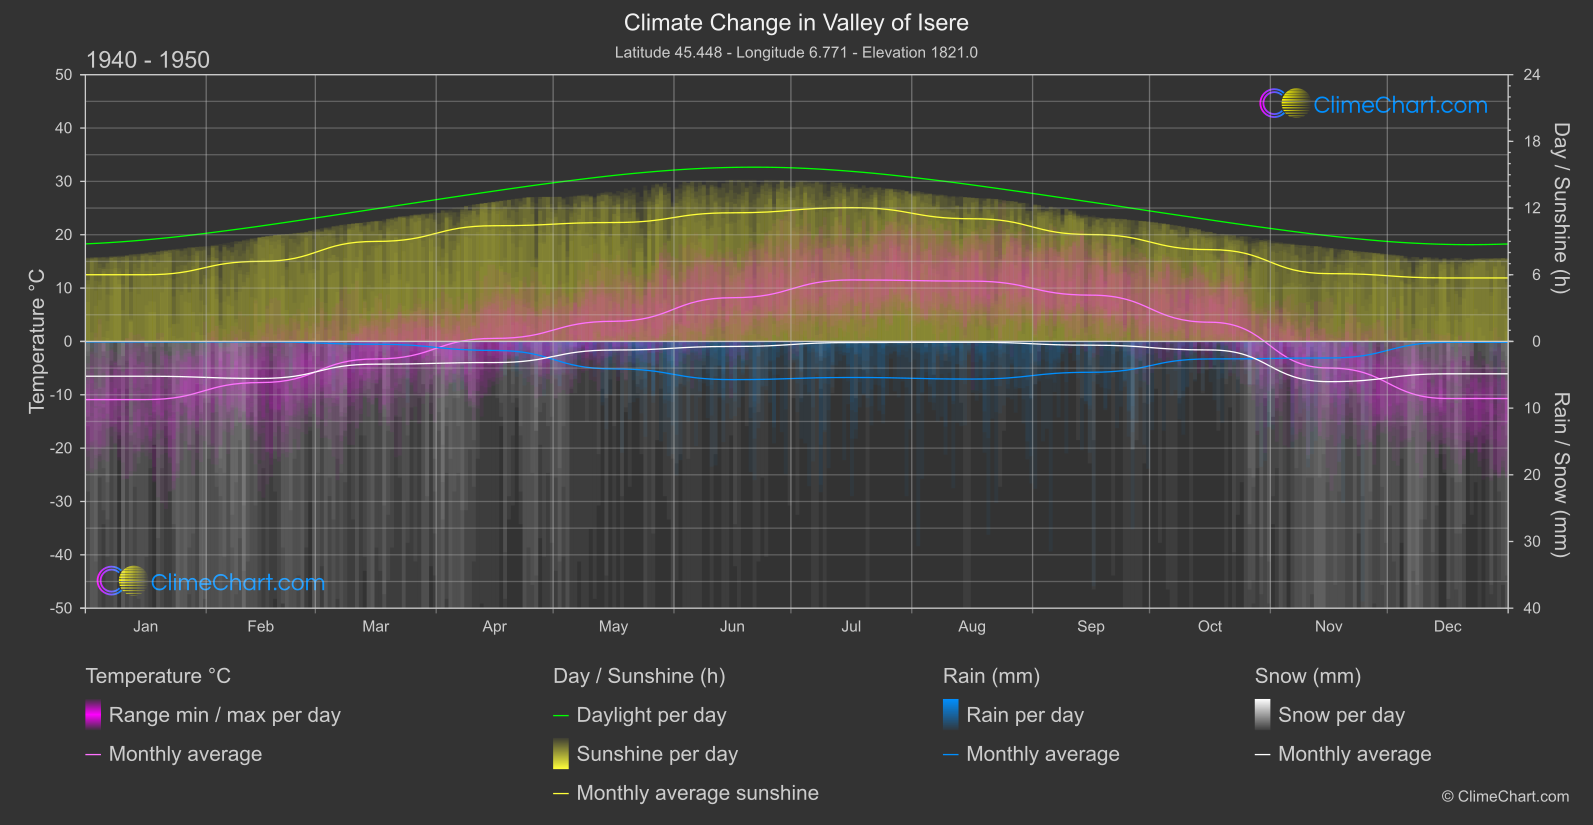
Valley of Isere in France has experienced significant climate changes over the years. Analyzing the temperature data from 1940 to 1950 compared to 2013 to 2024 reveals interesting patterns. For example, the month with the highest temperature change is December, with a substantial increase of 7.13°C. When it comes to rainfall, October shows the most significant change, with a 0.94mm increase. Snowfall has also varied, with March experiencing the largest change of 1.64mm. Additionally, sunshine duration has fluctuated, with June showing the highest increase in hours of sunshine.
Climate Change Data Overview for Valley of Isere, France
Explore the comprehensive climate change data for Valley of Isere, France. This detailed table provides valuable insights into temperature variations, precipitation levels, and seasonal changes influenced by climate change, helping you understand the unique weather patterns of this region.
Temperature °C
| Month | ⌀ 1940 - 1950 | ⌀ 2013 - 2023 | +/- |
|---|---|---|---|
| Jan | -10.90 | -5.96 | 4.94 |
| Feb | -7.71 | -4.28 | 3.43 |
| Mar | -3.28 | -2.02 | 1.26 |
| Apr | 0.57 | 1.36 | 0.79 |
| May | 3.77 | 4.83 | 1.06 |
| Jun | 8.20 | 10.68 | 2.48 |
| Jul | 11.52 | 13.79 | 2.26 |
| Aug | 11.30 | 13.08 | 1.78 |
| Sep | 8.68 | 9.53 | 0.86 |
| Oct | 3.60 | 5.68 | 2.07 |
| Nov | -4.98 | -1.00 | 3.98 |
| Dec | -10.70 | -3.58 | 7.13 |
| ⌀ Month | 0.84 | 3.51 | 2.67 |
Sunshine (h)
| Month | ⌀ 1940 - 1950 | ⌀ 2013 - 2023 | +/- |
|---|---|---|---|
| Jan | 6.00 | 5.61 | -0.39 |
| Feb | 7.20 | 6.82 | -0.38 |
| Mar | 9.00 | 8.20 | -0.80 |
| Apr | 10.41 | 9.91 | -0.51 |
| May | 10.70 | 10.26 | -0.44 |
| Jun | 11.57 | 12.02 | 0.45 |
| Jul | 12.04 | 12.17 | 0.13 |
| Aug | 11.04 | 11.13 | 0.09 |
| Sep | 9.62 | 9.66 | 0.04 |
| Oct | 8.26 | 7.78 | -0.48 |
| Nov | 6.10 | 5.81 | -0.29 |
| Dec | 5.71 | 5.18 | -0.54 |
| ⌀ Month | 8.97 | 8.71 | -0.26 |
Rain (mm)
| Month | ⌀ 1940 - 1950 | ⌀ 2013 - 2023 | +/- |
|---|---|---|---|
| Jan | 0.04 | 0.06 | 0.03 |
| Feb | 0.03 | 0.10 | 0.07 |
| Mar | 0.21 | 0.11 | -0.10 |
| Apr | 0.68 | 0.64 | -0.03 |
| May | 2.06 | 2.23 | 0.18 |
| Jun | 2.86 | 3.36 | 0.50 |
| Jul | 2.70 | 3.30 | 0.60 |
| Aug | 2.82 | 3.18 | 0.36 |
| Sep | 2.31 | 2.31 | 0.00 |
| Oct | 1.31 | 2.25 | 0.94 |
| Nov | 1.24 | 0.96 | -0.28 |
| Dec | 0.07 | 0.21 | 0.14 |
| ⌀ Month | 1.36 | 1.56 | 0.20 |
Snow (mm)
| Month | ⌀ 1940 - 1950 | ⌀ 2013 - 2023 | +/- |
|---|---|---|---|
| Jan | 2.61 | 4.03 | 1.42 |
| Feb | 2.77 | 3.09 | 0.31 |
| Mar | 1.70 | 3.34 | 1.64 |
| Apr | 1.58 | 1.89 | 0.30 |
| May | 0.64 | 1.85 | 1.21 |
| Jun | 0.38 | 0.08 | -0.30 |
| Jul | 0.08 | 0.02 | -0.06 |
| Aug | 0.06 | 0.09 | 0.02 |
| Sep | 0.28 | 0.37 | 0.09 |
| Oct | 0.64 | 0.75 | 0.11 |
| Nov | 3.02 | 3.02 | 0.00 |
| Dec | 2.43 | 3.74 | 1.31 |
| ⌀ Month | 1.35 | 1.86 | 0.51 |