Climate Change Chart of Valle de Guadalupe, Mexico
Comprehensive Climate Change Chart of Valle de Guadalupe, Mexico: Monthly Averages and Impact Trends
Explore the changing climate in Valle de Guadalupe, Mexico, through insightful data analysis.
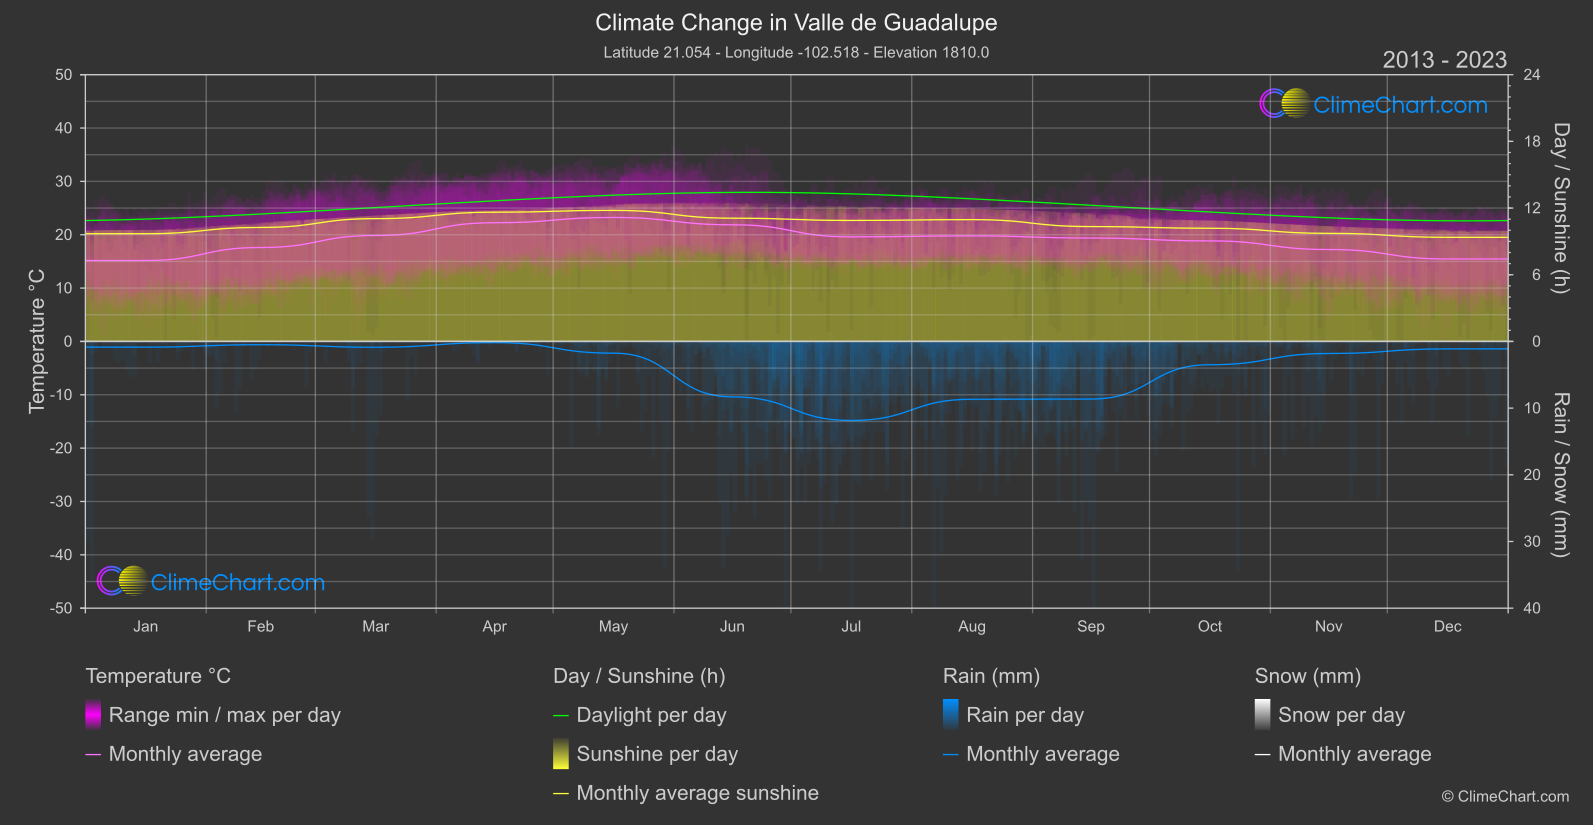
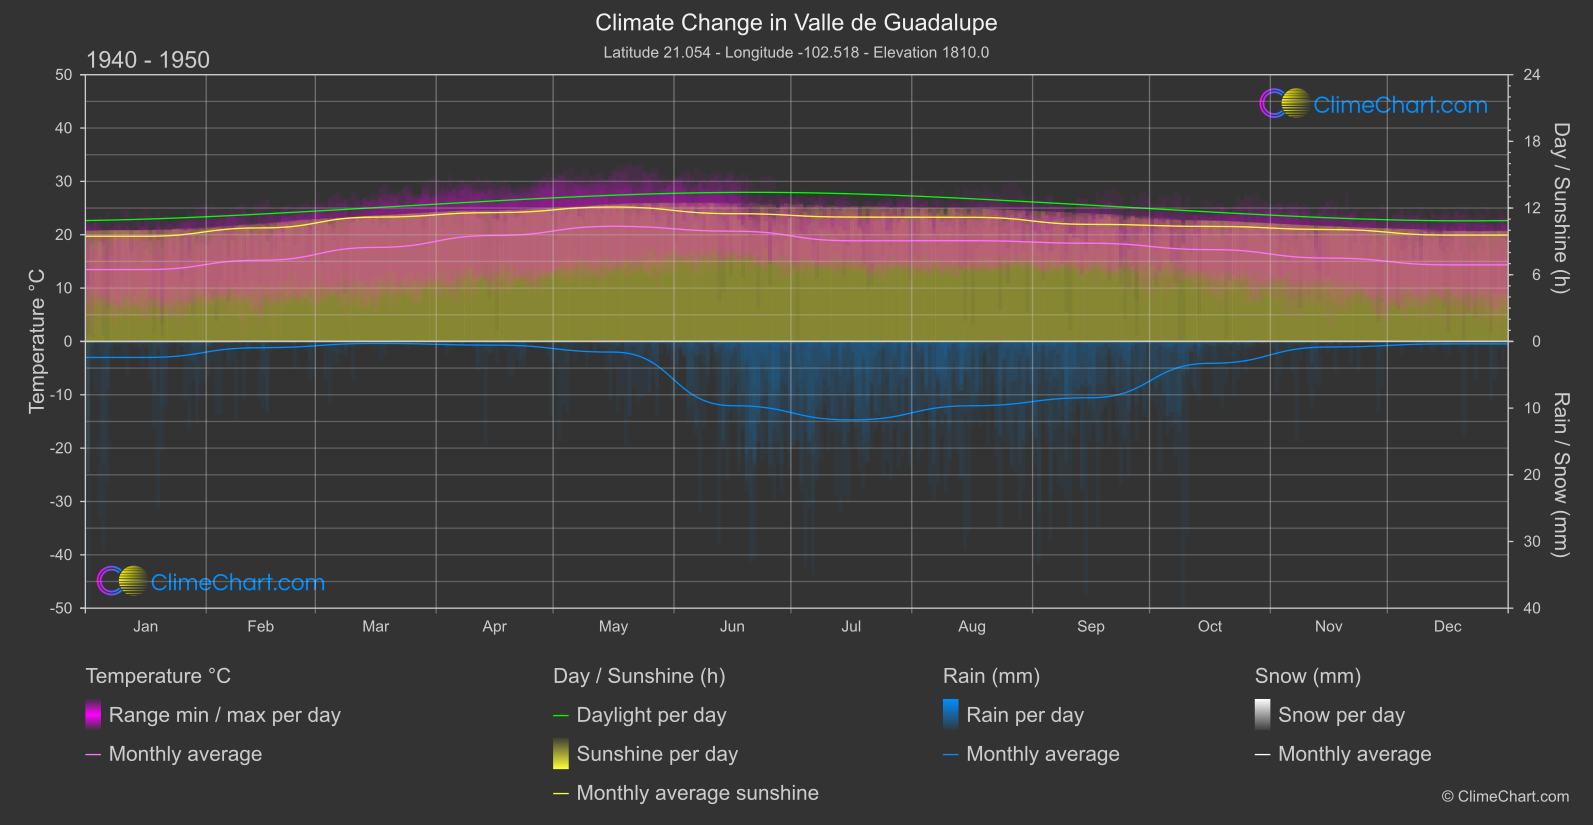
Valle de Guadalupe in Mexico has experienced notable changes in temperature, rainfall, snowfall, and sunshine duration over the years. From January to December, the data reveals how the climate has evolved from 1940 - 1950 to 2013 - 2024. Noteworthy trends include an increase in temperatures during the summer months and a decrease in rainfall during the winter months. Understanding these climate shifts is crucial for monitoring and adapting to the changing environment.
Climate Change Data Overview for Valle de Guadalupe, Mexico
Explore the comprehensive climate change data for Valle de Guadalupe, Mexico. This detailed table provides valuable insights into temperature variations, precipitation levels, and seasonal changes influenced by climate change, helping you understand the unique weather patterns of this region.
Temperature °C
| Month | ⌀ 1940 - 1950 | ⌀ 2013 - 2023 | +/- |
|---|---|---|---|
| Jan | 13.47 | 15.17 | 1.70 |
| Feb | 15.21 | 17.61 | 2.39 |
| Mar | 17.63 | 19.86 | 2.23 |
| Apr | 19.86 | 22.25 | 2.39 |
| May | 21.59 | 23.23 | 1.65 |
| Jun | 20.66 | 21.86 | 1.20 |
| Jul | 18.87 | 19.60 | 0.73 |
| Aug | 18.88 | 19.78 | 0.91 |
| Sep | 18.40 | 19.38 | 0.98 |
| Oct | 17.21 | 18.84 | 1.63 |
| Nov | 15.62 | 17.23 | 1.61 |
| Dec | 14.35 | 15.46 | 1.10 |
| ⌀ Month | 17.65 | 19.19 | 1.54 |
Sunshine (h)
| Month | ⌀ 1940 - 1950 | ⌀ 2013 - 2023 | +/- |
|---|---|---|---|
| Jan | 9.47 | 9.69 | 0.22 |
| Feb | 10.21 | 10.26 | 0.04 |
| Mar | 11.18 | 11.05 | -0.14 |
| Apr | 11.59 | 11.63 | 0.04 |
| May | 12.09 | 11.79 | -0.30 |
| Jun | 11.50 | 11.09 | -0.41 |
| Jul | 11.19 | 10.89 | -0.30 |
| Aug | 11.17 | 10.96 | -0.21 |
| Sep | 10.53 | 10.33 | -0.20 |
| Oct | 10.35 | 10.18 | -0.17 |
| Nov | 10.07 | 9.72 | -0.35 |
| Dec | 9.57 | 9.37 | -0.20 |
| ⌀ Month | 10.74 | 10.58 | -0.16 |
Rain (mm)
| Month | ⌀ 1940 - 1950 | ⌀ 2013 - 2023 | +/- |
|---|---|---|---|
| Jan | 1.20 | 0.43 | -0.77 |
| Feb | 0.47 | 0.24 | -0.22 |
| Mar | 0.15 | 0.44 | 0.29 |
| Apr | 0.28 | 0.09 | -0.19 |
| May | 0.80 | 0.88 | 0.08 |
| Jun | 4.82 | 4.16 | -0.66 |
| Jul | 5.89 | 5.93 | 0.04 |
| Aug | 4.82 | 4.33 | -0.49 |
| Sep | 4.22 | 4.32 | 0.10 |
| Oct | 1.64 | 1.75 | 0.11 |
| Nov | 0.42 | 0.91 | 0.49 |
| Dec | 0.18 | 0.56 | 0.37 |
| ⌀ Month | 2.07 | 2.00 | -0.07 |
Snow (mm)
| Month | ⌀ 1940 - 1950 | ⌀ 2013 - 2023 | +/- |
|---|---|---|---|
| Jan | 0.01 | 0.00 | -0.01 |
| Feb | 0.00 | 0.00 | 0.00 |
| Mar | 0.00 | 0.00 | 0.00 |
| Apr | 0.00 | 0.00 | 0.00 |
| May | 0.00 | 0.00 | 0.00 |
| Jun | 0.00 | 0.00 | 0.00 |
| Jul | 0.00 | 0.00 | 0.00 |
| Aug | 0.00 | 0.00 | 0.00 |
| Sep | 0.00 | 0.00 | 0.00 |
| Oct | 0.00 | 0.00 | 0.00 |
| Nov | 0.00 | 0.00 | 0.00 |
| Dec | 0.00 | 0.00 | 0.00 |
| ⌀ Month | 0.00 | 0.00 | -0.00 |