Climate Change Chart of Tripoli, Libya
Comprehensive Climate Change Chart of Tripoli, Libya: Monthly Averages and Impact Trends
Exploring the changing climate in Tripoli, Libya reveals intriguing insights into temperature, rainfall, and sunshine duration trends. Let's delve into the data to uncover how the climate has evolved over the years.
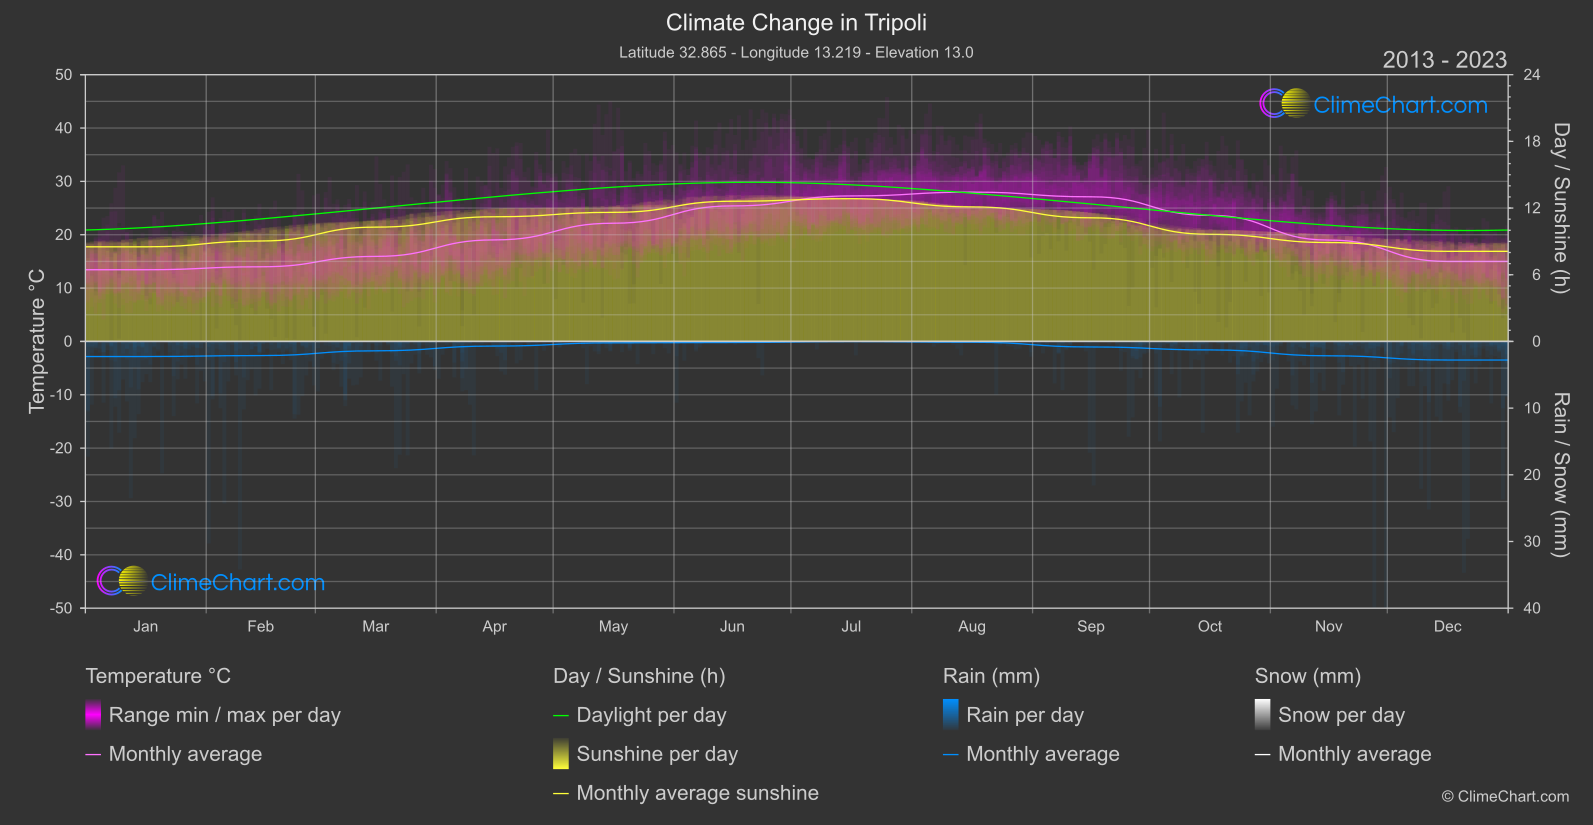
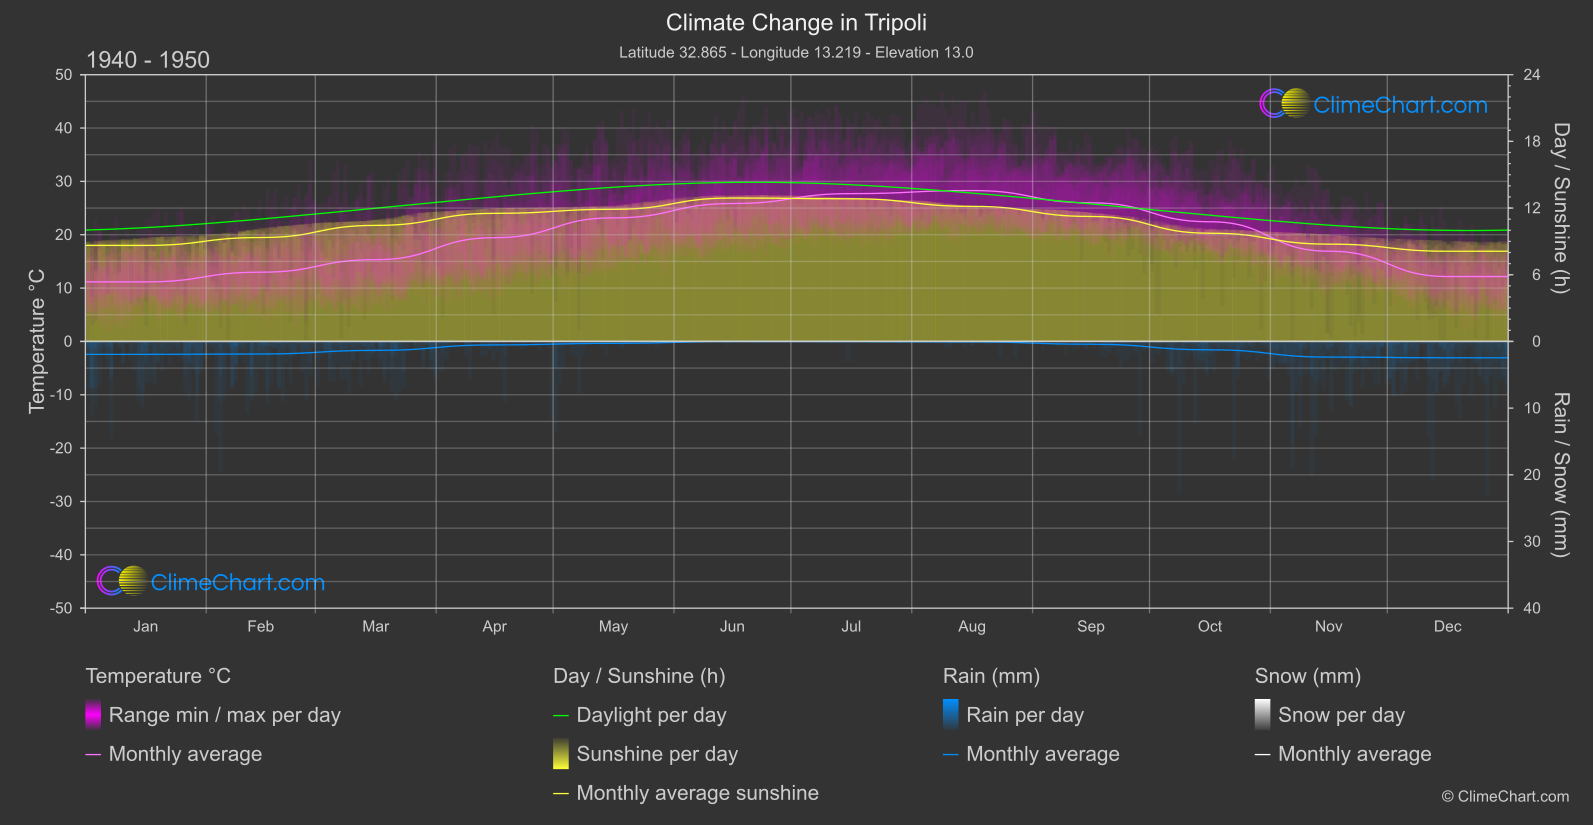
Tripoli, the capital of Libya, experiences notable changes in temperature, rainfall, and sunshine duration. Analyzing the data reveals that the month with the highest temperature change is December, showing an increase of 2.82°C from 1940-1950 to 2013-2024. Furthermore, September exhibits the most significant increase in rainfall, with a change of 0.21 mm. In terms of sunshine duration, November sees a notable rise of 0.15 hours.
Climate Change Data Overview for Tripoli, Libya
Explore the comprehensive climate change data for Tripoli, Libya. This detailed table provides valuable insights into temperature variations, precipitation levels, and seasonal changes influenced by climate change, helping you understand the unique weather patterns of this region.
Temperature °C
| Month | ⌀ 1940 - 1950 | ⌀ 2013 - 2023 | +/- |
|---|---|---|---|
| Jan | 11.16 | 13.44 | 2.27 |
| Feb | 12.98 | 13.99 | 1.01 |
| Mar | 15.32 | 15.94 | 0.61 |
| Apr | 19.45 | 19.03 | -0.42 |
| May | 23.17 | 22.16 | -1.01 |
| Jun | 25.85 | 25.40 | -0.45 |
| Jul | 27.71 | 27.27 | -0.43 |
| Aug | 28.28 | 27.99 | -0.29 |
| Sep | 25.98 | 27.11 | 1.13 |
| Oct | 22.43 | 23.63 | 1.20 |
| Nov | 16.92 | 19.00 | 2.08 |
| Dec | 12.17 | 14.99 | 2.82 |
| ⌀ Month | 20.12 | 20.83 | 0.71 |
Sunshine (h)
| Month | ⌀ 1940 - 1950 | ⌀ 2013 - 2023 | +/- |
|---|---|---|---|
| Jan | 8.64 | 8.51 | -0.13 |
| Feb | 9.35 | 9.04 | -0.31 |
| Mar | 10.44 | 10.28 | -0.16 |
| Apr | 11.52 | 11.22 | -0.31 |
| May | 11.89 | 11.61 | -0.27 |
| Jun | 12.90 | 12.61 | -0.29 |
| Jul | 12.83 | 12.84 | 0.01 |
| Aug | 12.15 | 12.10 | -0.05 |
| Sep | 11.24 | 11.12 | -0.12 |
| Oct | 9.74 | 9.64 | -0.10 |
| Nov | 8.75 | 8.90 | 0.15 |
| Dec | 8.11 | 8.11 | -0.01 |
| ⌀ Month | 10.63 | 10.50 | -0.13 |
Rain (mm)
| Month | ⌀ 1940 - 1950 | ⌀ 2013 - 2023 | +/- |
|---|---|---|---|
| Jan | 0.97 | 1.13 | 0.16 |
| Feb | 0.94 | 1.06 | 0.12 |
| Mar | 0.67 | 0.70 | 0.03 |
| Apr | 0.26 | 0.35 | 0.09 |
| May | 0.14 | 0.11 | -0.04 |
| Jun | 0.01 | 0.08 | 0.07 |
| Jul | 0.01 | 0.01 | -0.00 |
| Aug | 0.04 | 0.06 | 0.03 |
| Sep | 0.21 | 0.42 | 0.21 |
| Oct | 0.63 | 0.64 | 0.01 |
| Nov | 1.17 | 1.08 | -0.10 |
| Dec | 1.22 | 1.39 | 0.17 |
| ⌀ Month | 0.52 | 0.59 | 0.06 |
Snow (mm)
| Month | ⌀ 1940 - 1950 | ⌀ 2013 - 2023 | +/- |
|---|---|---|---|
| Jan | 0.00 | 0.00 | 0.00 |
| Feb | 0.00 | 0.00 | 0.00 |
| Mar | 0.00 | 0.00 | 0.00 |
| Apr | 0.00 | 0.00 | 0.00 |
| May | 0.00 | 0.00 | 0.00 |
| Jun | 0.00 | 0.00 | 0.00 |
| Jul | 0.00 | 0.00 | 0.00 |
| Aug | 0.00 | 0.00 | 0.00 |
| Sep | 0.00 | 0.00 | 0.00 |
| Oct | 0.00 | 0.00 | 0.00 |
| Nov | 0.00 | 0.00 | 0.00 |
| Dec | 0.00 | 0.00 | 0.00 |
| ⌀ Month | 0.00 | 0.00 | 0.00 |