Climate Change Chart of Trenton, USA
Comprehensive Climate Change Chart of Trenton, USA: Monthly Averages and Impact Trends
Explore the changing climate in Trenton, USA with insightful data analysis.
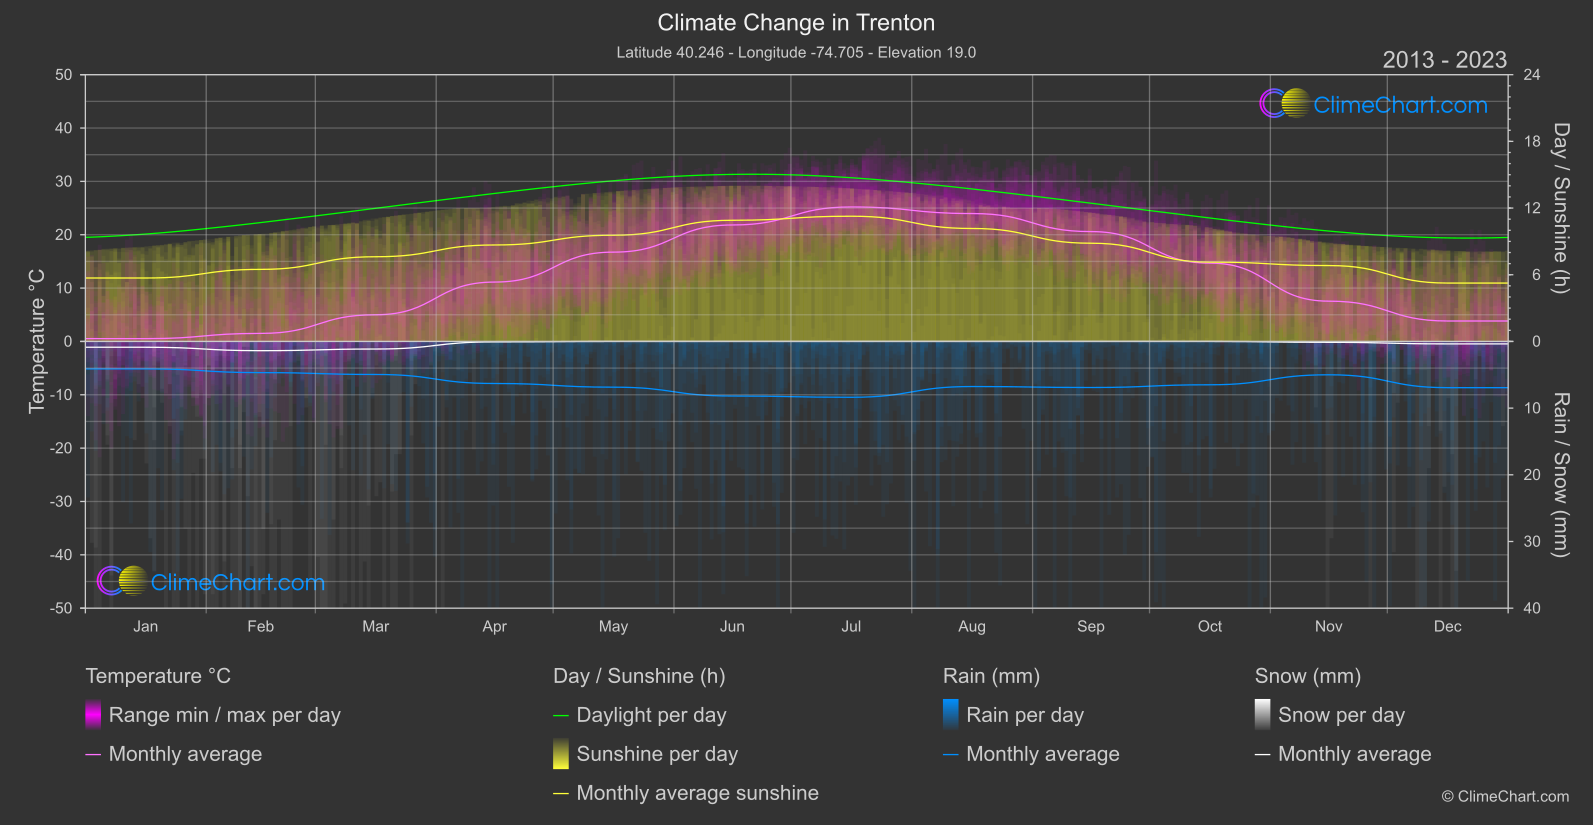
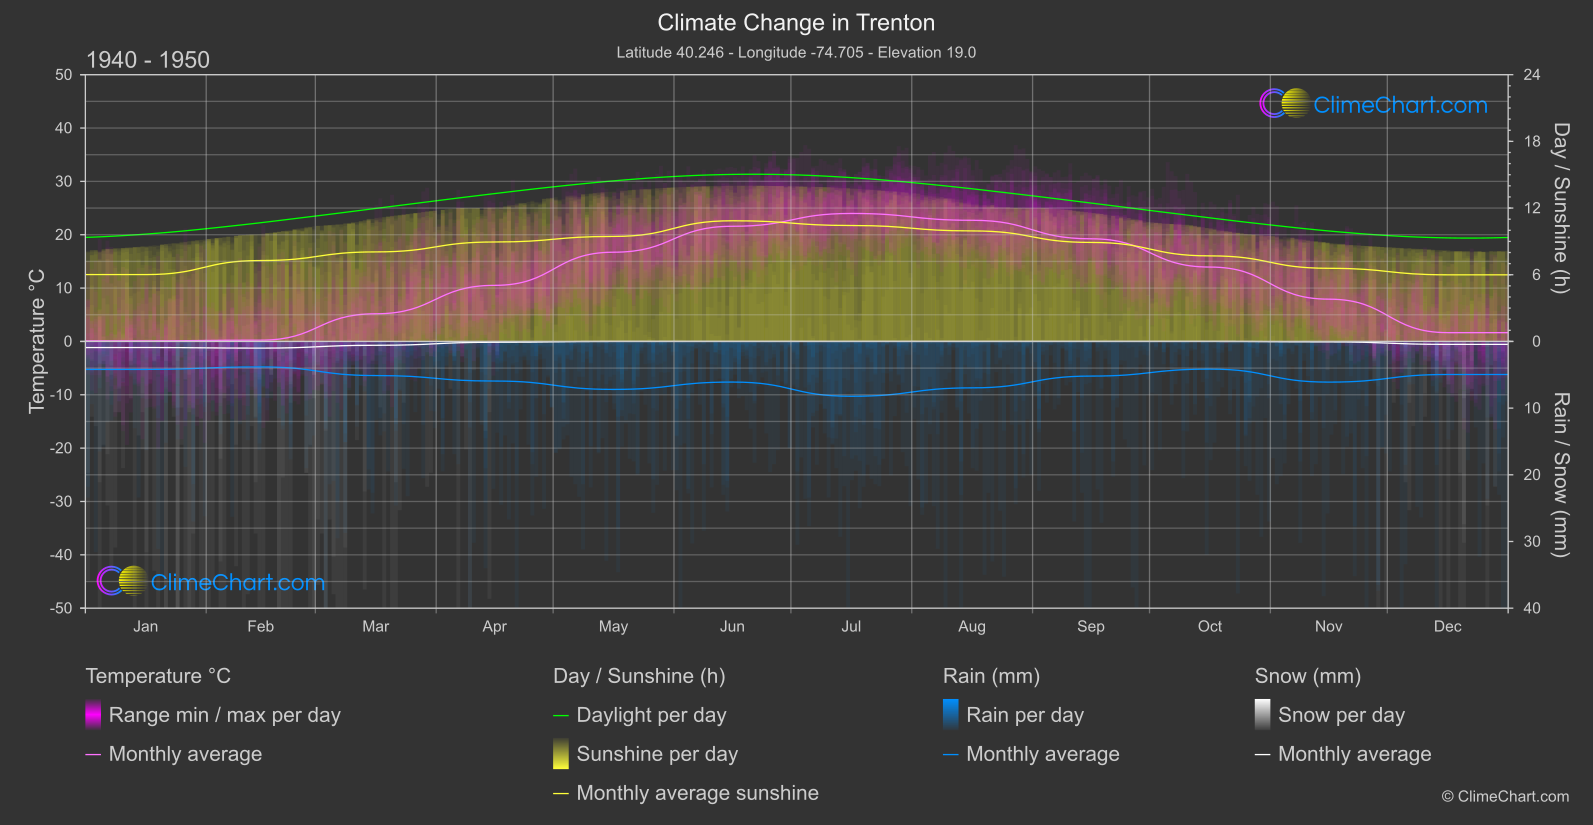
Trenton, USA, experiences varying climate patterns with noticeable changes in temperature, rainfall, snowfall, and sunshine duration. Analysis of the data reveals interesting insights such as significant temperature increases in December and August, as well as fluctuations in rainfall throughout the year. Additionally, the comparison between the years 1940-1950 and 2013-2024 indicates shifts in climate trends over time, highlighting the importance of monitoring and understanding climate change.
Climate Change Data Overview for Trenton, USA
Explore the comprehensive climate change data for Trenton, USA. This detailed table provides valuable insights into temperature variations, precipitation levels, and seasonal changes influenced by climate change, helping you understand the unique weather patterns of this region.
Temperature °C
| Month | ⌀ 1940 - 1950 | ⌀ 2013 - 2023 | +/- |
|---|---|---|---|
| Jan | 0.11 | 0.52 | 0.41 |
| Feb | 0.24 | 1.51 | 1.27 |
| Mar | 5.18 | 5.00 | -0.18 |
| Apr | 10.51 | 11.13 | 0.62 |
| May | 16.72 | 16.74 | 0.01 |
| Jun | 21.58 | 21.83 | 0.25 |
| Jul | 23.99 | 25.21 | 1.22 |
| Aug | 22.71 | 23.97 | 1.27 |
| Sep | 19.24 | 20.59 | 1.35 |
| Oct | 13.94 | 14.68 | 0.73 |
| Nov | 7.92 | 7.55 | -0.37 |
| Dec | 1.65 | 3.83 | 2.18 |
| ⌀ Month | 11.98 | 12.71 | 0.73 |
Sunshine (h)
| Month | ⌀ 1940 - 1950 | ⌀ 2013 - 2023 | +/- |
|---|---|---|---|
| Jan | 6.01 | 5.71 | -0.31 |
| Feb | 7.28 | 6.48 | -0.80 |
| Mar | 8.05 | 7.62 | -0.44 |
| Apr | 8.95 | 8.68 | -0.27 |
| May | 9.45 | 9.56 | 0.11 |
| Jun | 10.86 | 10.90 | 0.04 |
| Jul | 10.43 | 11.27 | 0.83 |
| Aug | 9.94 | 10.16 | 0.22 |
| Sep | 8.91 | 8.84 | -0.07 |
| Oct | 7.70 | 7.14 | -0.56 |
| Nov | 6.58 | 6.83 | 0.25 |
| Dec | 5.99 | 5.25 | -0.74 |
| ⌀ Month | 8.35 | 8.20 | -0.14 |
Rain (mm)
| Month | ⌀ 1940 - 1950 | ⌀ 2013 - 2023 | +/- |
|---|---|---|---|
| Jan | 2.10 | 2.06 | -0.04 |
| Feb | 1.91 | 2.34 | 0.43 |
| Mar | 2.56 | 2.48 | -0.08 |
| Apr | 2.97 | 3.15 | 0.18 |
| May | 3.60 | 3.43 | -0.17 |
| Jun | 3.05 | 4.09 | 1.05 |
| Jul | 4.11 | 4.19 | 0.07 |
| Aug | 3.48 | 3.38 | -0.10 |
| Sep | 2.60 | 3.45 | 0.86 |
| Oct | 2.08 | 3.25 | 1.18 |
| Nov | 3.05 | 2.50 | -0.55 |
| Dec | 2.48 | 3.47 | 0.99 |
| ⌀ Month | 2.83 | 3.15 | 0.32 |
Snow (mm)
| Month | ⌀ 1940 - 1950 | ⌀ 2013 - 2023 | +/- |
|---|---|---|---|
| Jan | 0.46 | 0.44 | -0.02 |
| Feb | 0.50 | 0.69 | 0.19 |
| Mar | 0.29 | 0.57 | 0.28 |
| Apr | 0.06 | 0.03 | -0.03 |
| May | 0.00 | 0.00 | 0.00 |
| Jun | 0.00 | 0.00 | 0.00 |
| Jul | 0.00 | 0.00 | 0.00 |
| Aug | 0.00 | 0.00 | 0.00 |
| Sep | 0.00 | 0.00 | 0.00 |
| Oct | 0.00 | 0.00 | 0.00 |
| Nov | 0.03 | 0.07 | 0.03 |
| Dec | 0.22 | 0.18 | -0.04 |
| ⌀ Month | 0.13 | 0.17 | 0.03 |