Climate Change Chart of Toulouse, France
Comprehensive Climate Change Chart of Toulouse, France: Monthly Averages and Impact Trends
Explore the changing climate of Toulouse, France, through insightful data analysis. Discover how temperature, rainfall, snowfall, and sunshine duration have evolved over the years.
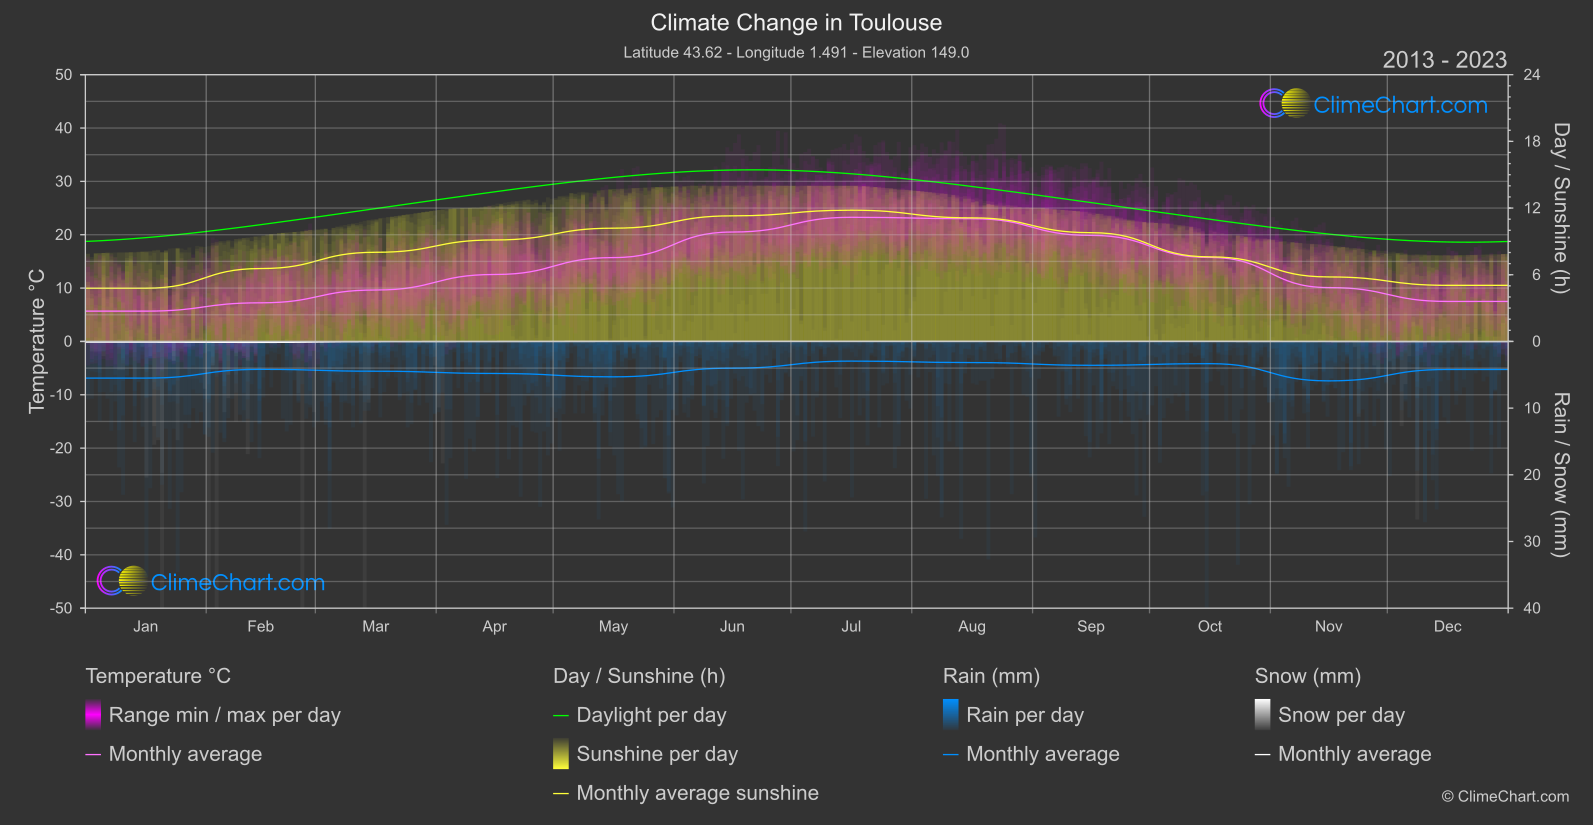
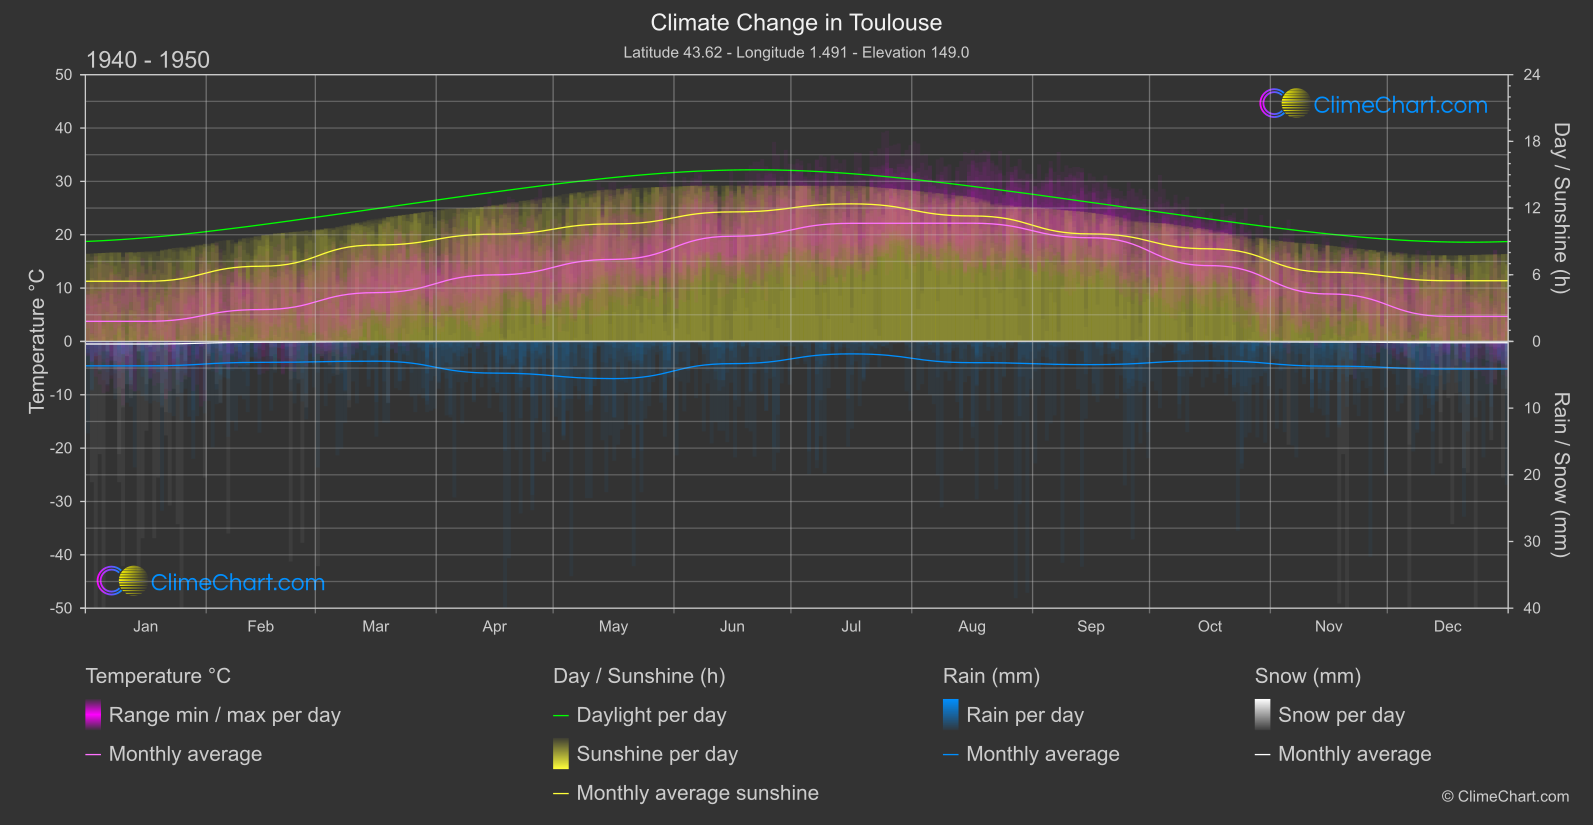
In Toulouse, France, the climate has shown significant changes over the years. Analyzing the data from 1940 to 1950 compared to 2013 to 2024, we observe a trend of increasing temperatures across the months. The month with the highest temperature change is December, with a significant increase of 2.80°C. On the other hand, rainfall patterns have also shifted, with notable changes in November, showing a 1.10mm increase in precipitation. Snowfall and sunshine duration have experienced varying trends, with some months showing decreases and others remaining stable.
Climate Change Data Overview for Toulouse, France
Explore the comprehensive climate change data for Toulouse, France. This detailed table provides valuable insights into temperature variations, precipitation levels, and seasonal changes influenced by climate change, helping you understand the unique weather patterns of this region.
Temperature °C
| Month | ⌀ 1940 - 1950 | ⌀ 2013 - 2023 | +/- |
|---|---|---|---|
| Jan | 3.77 | 5.68 | 1.91 |
| Feb | 5.97 | 7.24 | 1.27 |
| Mar | 9.15 | 9.64 | 0.49 |
| Apr | 12.48 | 12.55 | 0.07 |
| May | 15.37 | 15.72 | 0.34 |
| Jun | 19.72 | 20.51 | 0.78 |
| Jul | 22.14 | 23.27 | 1.13 |
| Aug | 22.16 | 23.00 | 0.85 |
| Sep | 19.43 | 19.88 | 0.45 |
| Oct | 14.21 | 15.74 | 1.53 |
| Nov | 8.90 | 10.09 | 1.19 |
| Dec | 4.69 | 7.50 | 2.80 |
| ⌀ Month | 13.17 | 14.23 | 1.07 |
Sunshine (h)
| Month | ⌀ 1940 - 1950 | ⌀ 2013 - 2023 | +/- |
|---|---|---|---|
| Jan | 5.41 | 4.79 | -0.63 |
| Feb | 6.76 | 6.56 | -0.21 |
| Mar | 8.67 | 8.02 | -0.65 |
| Apr | 9.65 | 9.13 | -0.52 |
| May | 10.57 | 10.19 | -0.38 |
| Jun | 11.65 | 11.30 | -0.35 |
| Jul | 12.38 | 11.81 | -0.57 |
| Aug | 11.29 | 11.12 | -0.17 |
| Sep | 9.67 | 9.78 | 0.11 |
| Oct | 8.33 | 7.61 | -0.72 |
| Nov | 6.23 | 5.80 | -0.43 |
| Dec | 5.46 | 5.05 | -0.42 |
| ⌀ Month | 8.84 | 8.43 | -0.41 |
Rain (mm)
| Month | ⌀ 1940 - 1950 | ⌀ 2013 - 2023 | +/- |
|---|---|---|---|
| Jan | 1.83 | 2.75 | 0.92 |
| Feb | 1.57 | 2.09 | 0.53 |
| Mar | 1.48 | 2.23 | 0.75 |
| Apr | 2.38 | 2.40 | 0.03 |
| May | 2.79 | 2.65 | -0.13 |
| Jun | 1.66 | 2.00 | 0.34 |
| Jul | 0.93 | 1.48 | 0.54 |
| Aug | 1.59 | 1.58 | -0.01 |
| Sep | 1.74 | 1.79 | 0.05 |
| Oct | 1.45 | 1.67 | 0.21 |
| Nov | 1.85 | 2.96 | 1.10 |
| Dec | 2.06 | 2.10 | 0.04 |
| ⌀ Month | 1.78 | 2.14 | 0.36 |
Snow (mm)
| Month | ⌀ 1940 - 1950 | ⌀ 2013 - 2023 | +/- |
|---|---|---|---|
| Jan | 0.19 | 0.05 | -0.14 |
| Feb | 0.06 | 0.08 | 0.01 |
| Mar | 0.01 | 0.02 | 0.00 |
| Apr | 0.00 | 0.01 | 0.01 |
| May | 0.00 | 0.00 | 0.00 |
| Jun | 0.00 | 0.00 | 0.00 |
| Jul | 0.00 | 0.00 | 0.00 |
| Aug | 0.00 | 0.00 | 0.00 |
| Sep | 0.00 | 0.00 | 0.00 |
| Oct | 0.00 | 0.00 | 0.00 |
| Nov | 0.05 | 0.01 | -0.04 |
| Dec | 0.10 | 0.02 | -0.08 |
| ⌀ Month | 0.03 | 0.01 | -0.02 |