Climate Change Chart of Topeka, USA
Comprehensive Climate Change Chart of Topeka, USA: Monthly Averages and Impact Trends
Explore the changing climate in Topeka, USA, with insightful data analysis. Discover the trends in temperature, rainfall, snowfall, and sunshine duration from 1940 to 1950 compared to 2013 to 2024.
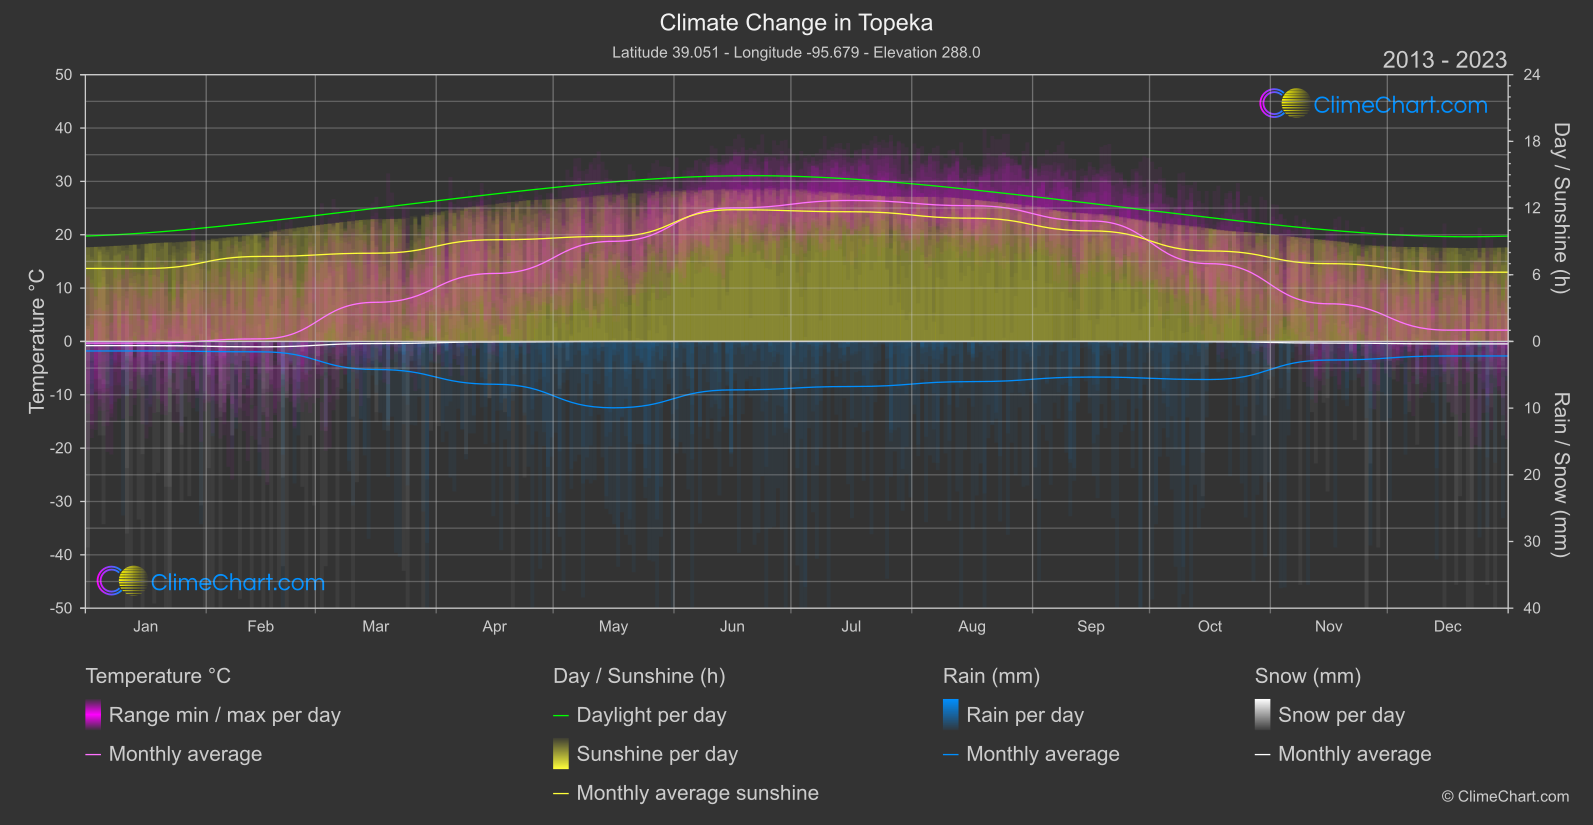
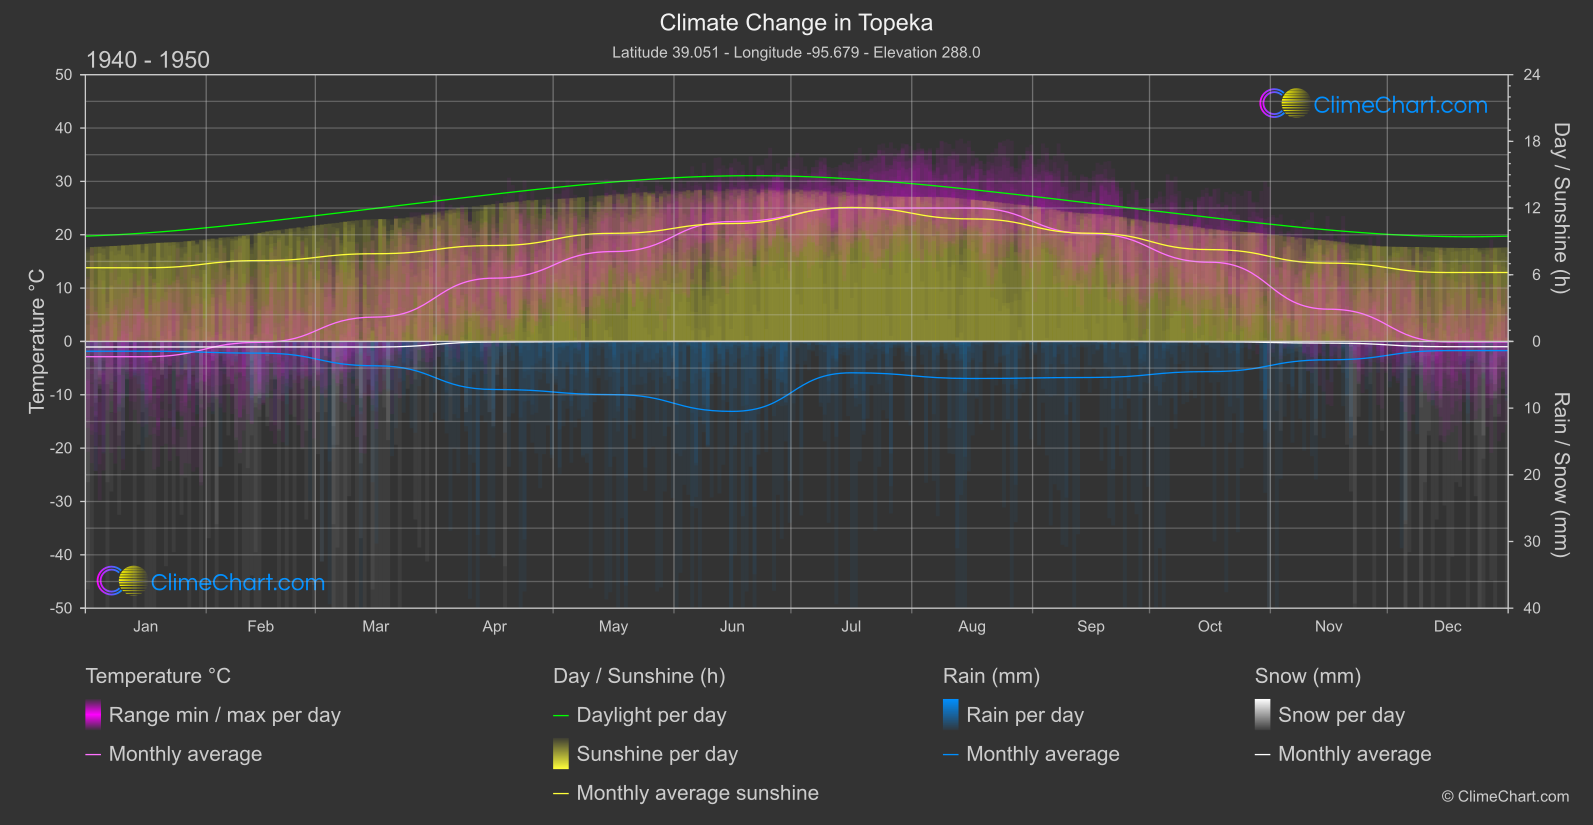
Topeka, USA, has experienced notable changes in climate indicators over the years. From January to December, the data shows varying shifts in temperature, rainfall, snowfall, and sunshine duration between the two time periods. Notably, June has seen a significant temperature increase of 2.57°C, while June experienced a substantial decrease in rainfall of -1.61mm. Explore the nuances of climate change in Topeka through this comprehensive data comparison.
Climate Change Data Overview for Topeka, USA
Explore the comprehensive climate change data for Topeka, USA. This detailed table provides valuable insights into temperature variations, precipitation levels, and seasonal changes influenced by climate change, helping you understand the unique weather patterns of this region.
Temperature °C
| Month | ⌀ 1940 - 1950 | ⌀ 2013 - 2023 | +/- |
|---|---|---|---|
| Jan | -2.86 | -0.31 | 2.55 |
| Feb | -0.16 | 0.48 | 0.65 |
| Mar | 4.57 | 7.34 | 2.77 |
| Apr | 11.86 | 12.75 | 0.88 |
| May | 16.85 | 18.77 | 1.92 |
| Jun | 22.46 | 25.03 | 2.57 |
| Jul | 25.01 | 26.42 | 1.41 |
| Aug | 25.00 | 25.44 | 0.44 |
| Sep | 20.18 | 22.58 | 2.40 |
| Oct | 14.85 | 14.57 | -0.28 |
| Nov | 6.04 | 7.06 | 1.01 |
| Dec | -0.09 | 2.12 | 2.21 |
| ⌀ Month | 11.98 | 13.52 | 1.54 |
Sunshine (h)
| Month | ⌀ 1940 - 1950 | ⌀ 2013 - 2023 | +/- |
|---|---|---|---|
| Jan | 6.63 | 6.57 | -0.06 |
| Feb | 7.27 | 7.65 | 0.37 |
| Mar | 7.89 | 7.94 | 0.05 |
| Apr | 8.63 | 9.15 | 0.52 |
| May | 9.73 | 9.46 | -0.27 |
| Jun | 10.61 | 11.85 | 1.24 |
| Jul | 12.05 | 11.67 | -0.39 |
| Aug | 11.02 | 11.09 | 0.07 |
| Sep | 9.73 | 9.95 | 0.21 |
| Oct | 8.26 | 8.14 | -0.12 |
| Nov | 7.05 | 7.00 | -0.05 |
| Dec | 6.20 | 6.23 | 0.03 |
| ⌀ Month | 8.76 | 8.89 | 0.13 |
Rain (mm)
| Month | ⌀ 1940 - 1950 | ⌀ 2013 - 2023 | +/- |
|---|---|---|---|
| Jan | 0.73 | 0.72 | -0.02 |
| Feb | 0.88 | 0.78 | -0.10 |
| Mar | 1.83 | 2.10 | 0.28 |
| Apr | 3.60 | 3.21 | -0.39 |
| May | 3.99 | 4.98 | 0.99 |
| Jun | 5.24 | 3.63 | -1.61 |
| Jul | 2.35 | 3.38 | 1.03 |
| Aug | 2.78 | 3.01 | 0.23 |
| Sep | 2.70 | 2.67 | -0.03 |
| Oct | 2.26 | 2.86 | 0.60 |
| Nov | 1.38 | 1.40 | 0.02 |
| Dec | 0.69 | 1.09 | 0.40 |
| ⌀ Month | 2.37 | 2.49 | 0.12 |
Snow (mm)
| Month | ⌀ 1940 - 1950 | ⌀ 2013 - 2023 | +/- |
|---|---|---|---|
| Jan | 0.42 | 0.31 | -0.10 |
| Feb | 0.41 | 0.40 | -0.01 |
| Mar | 0.42 | 0.16 | -0.26 |
| Apr | 0.04 | 0.04 | 0.00 |
| May | 0.00 | 0.00 | 0.00 |
| Jun | 0.00 | 0.00 | 0.00 |
| Jul | 0.00 | 0.00 | 0.00 |
| Aug | 0.00 | 0.00 | 0.00 |
| Sep | 0.00 | 0.00 | 0.00 |
| Oct | 0.03 | 0.02 | -0.00 |
| Nov | 0.13 | 0.12 | -0.00 |
| Dec | 0.39 | 0.18 | -0.21 |
| ⌀ Month | 0.15 | 0.10 | -0.05 |