Climate Change Chart of Tomsk (Sibiria), Russian Federation
Comprehensive Climate Change Chart of Tomsk (Sibiria), Russian Federation: Monthly Averages and Impact Trends
Explore the changing climate trends in Tomsk, Sibiria, Russian Federation with insightful data analysis. Discover how temperatures, rainfall, snowfall, and sunshine duration have evolved over the years.
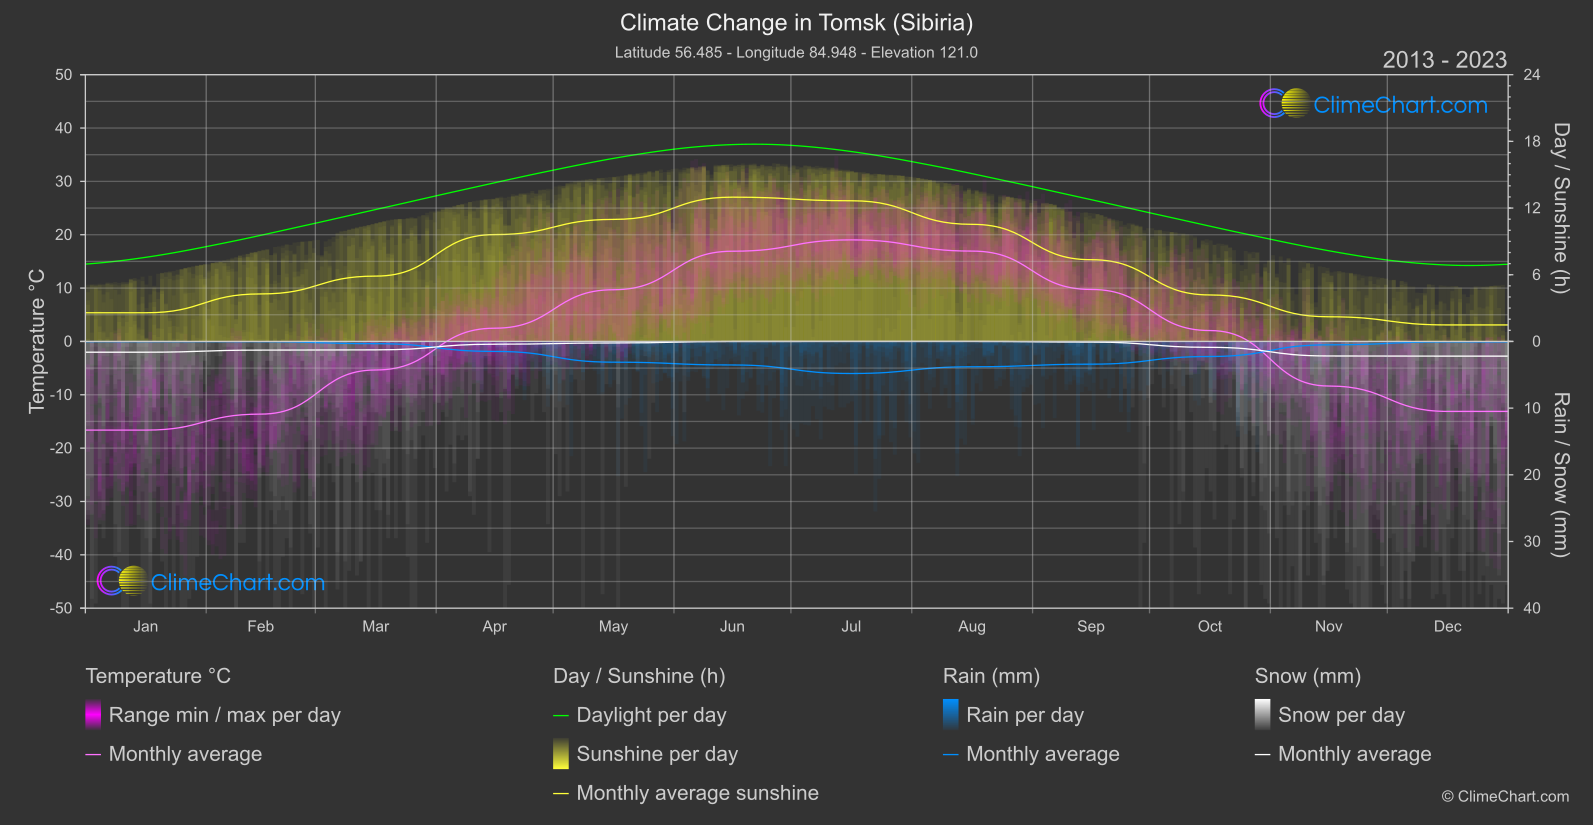
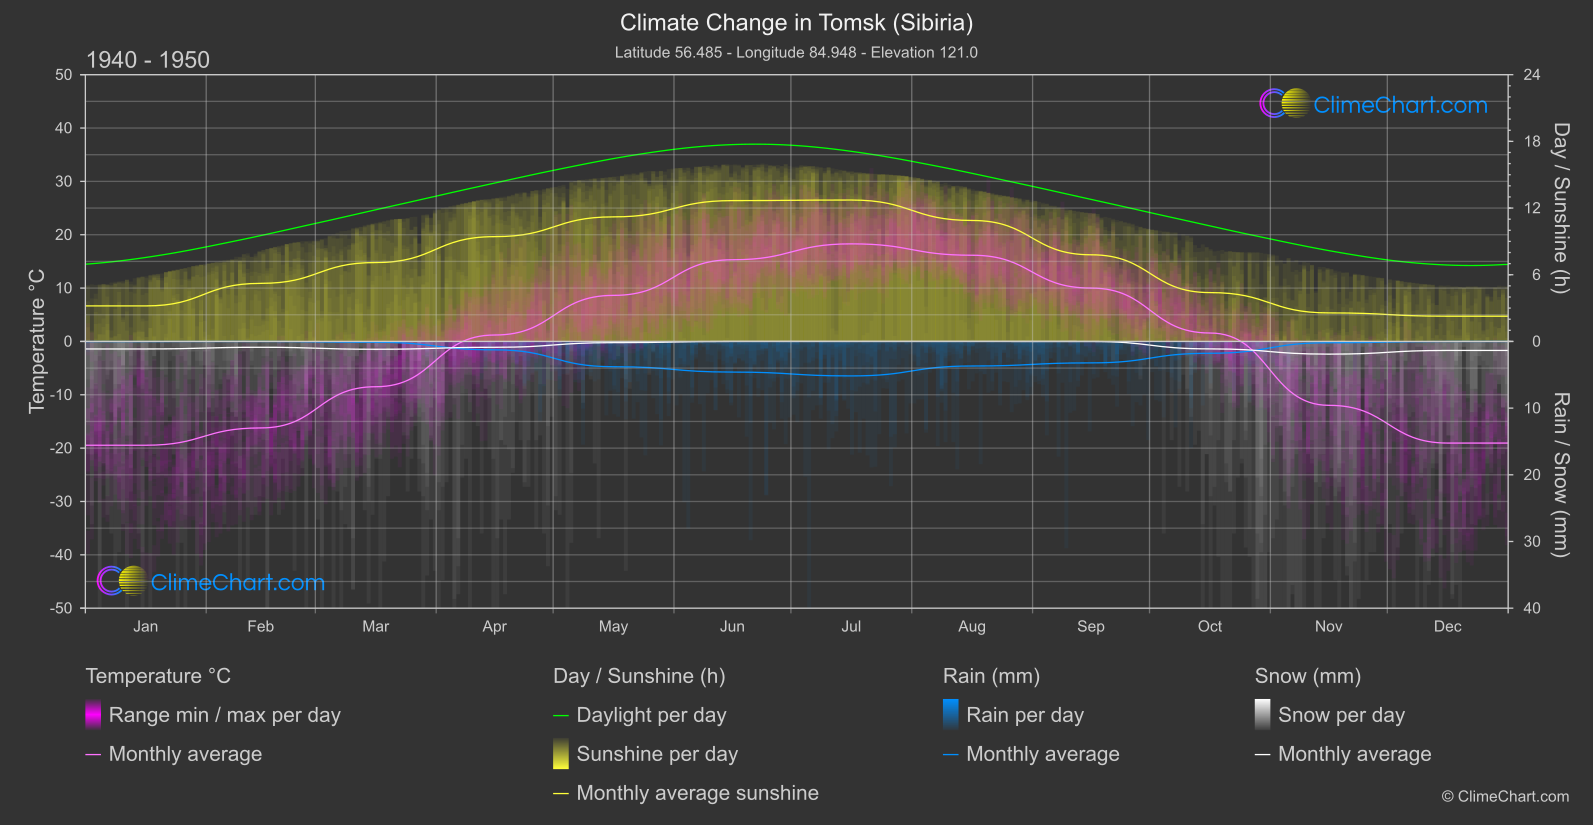
Dive deeper into the climate and weather patterns in Tomsk, Sibiria, Russian Federation. Analyzing the data from 1940 to 1950 compared to 2013 to 2024 reveals interesting insights. For instance, the month of December showed the highest temperature change of 5.93°C, indicating significant warming over the years. In terms of rainfall, March experienced the greatest increase of 10.47 mm. Snowfall in December also notably rose by 0.43 mm, suggesting changing precipitation patterns. Furthermore, the sunshine duration in December decreased by 0.79 hours, highlighting potential shifts in climate conditions.
Climate Change Data Overview for Tomsk (Sibiria), Russian Federation
Explore the comprehensive climate change data for Tomsk (Sibiria), Russian Federation. This detailed table provides valuable insights into temperature variations, precipitation levels, and seasonal changes influenced by climate change, helping you understand the unique weather patterns of this region.
Temperature °C
| Month | ⌀ 1940 - 1950 | ⌀ 2013 - 2023 | +/- |
|---|---|---|---|
| Jan | -19.46 | -16.62 | 2.84 |
| Feb | -16.21 | -13.62 | 2.59 |
| Mar | -8.49 | -5.35 | 3.14 |
| Apr | 1.20 | 2.48 | 1.28 |
| May | 8.63 | 9.69 | 1.06 |
| Jun | 15.31 | 16.91 | 1.60 |
| Jul | 18.29 | 19.04 | 0.75 |
| Aug | 16.16 | 16.93 | 0.78 |
| Sep | 10.00 | 9.74 | -0.26 |
| Oct | 1.58 | 2.04 | 0.46 |
| Nov | -11.98 | -8.36 | 3.62 |
| Dec | -19.05 | -13.12 | 5.93 |
| ⌀ Month | -0.33 | 1.65 | 1.98 |
Sunshine (h)
| Month | ⌀ 1940 - 1950 | ⌀ 2013 - 2023 | +/- |
|---|---|---|---|
| Jan | 3.20 | 2.58 | -0.62 |
| Feb | 5.23 | 4.27 | -0.95 |
| Mar | 7.10 | 5.88 | -1.22 |
| Apr | 9.43 | 9.61 | 0.19 |
| May | 11.21 | 10.98 | -0.23 |
| Jun | 12.67 | 12.98 | 0.31 |
| Jul | 12.72 | 12.66 | -0.06 |
| Aug | 10.88 | 10.54 | -0.35 |
| Sep | 7.80 | 7.35 | -0.44 |
| Oct | 4.39 | 4.18 | -0.21 |
| Nov | 2.57 | 2.22 | -0.35 |
| Dec | 2.27 | 1.48 | -0.79 |
| ⌀ Month | 7.45 | 7.06 | -0.39 |
Rain (mm)
| Month | ⌀ 1940 - 1950 | ⌀ 2013 - 2023 | +/- |
|---|---|---|---|
| Jan | 0.01 | 0.01 | 0.00 |
| Feb | 0.00 | 0.02 | 0.01 |
| Mar | 0.06 | 0.17 | 0.10 |
| Apr | 0.63 | 0.75 | 0.12 |
| May | 1.90 | 1.56 | -0.34 |
| Jun | 2.30 | 1.77 | -0.53 |
| Jul | 2.59 | 2.40 | -0.18 |
| Aug | 1.84 | 1.90 | 0.06 |
| Sep | 1.61 | 1.70 | 0.10 |
| Oct | 0.89 | 1.13 | 0.24 |
| Nov | 0.10 | 0.25 | 0.16 |
| Dec | 0.00 | 0.03 | 0.03 |
| ⌀ Month | 0.99 | 0.97 | -0.02 |
Snow (mm)
| Month | ⌀ 1940 - 1950 | ⌀ 2013 - 2023 | +/- |
|---|---|---|---|
| Jan | 0.56 | 0.81 | 0.24 |
| Feb | 0.44 | 0.65 | 0.21 |
| Mar | 0.59 | 0.63 | 0.04 |
| Apr | 0.44 | 0.21 | -0.23 |
| May | 0.09 | 0.11 | 0.02 |
| Jun | 0.00 | 0.00 | 0.00 |
| Jul | 0.00 | 0.00 | 0.00 |
| Aug | 0.00 | 0.00 | 0.00 |
| Sep | 0.00 | 0.05 | 0.04 |
| Oct | 0.56 | 0.44 | -0.12 |
| Nov | 0.95 | 1.09 | 0.14 |
| Dec | 0.67 | 1.10 | 0.43 |
| ⌀ Month | 0.36 | 0.43 | 0.07 |