Climate Change Chart of Tokyo, Japan
Comprehensive Climate Change Chart of Tokyo, Japan: Monthly Averages and Impact Trends
Explore the changing climate in Tokyo, Japan, with insights on temperature, rainfall, snowfall, and sunshine duration. Discover how the climate has evolved from 1940 to 1950 compared to 2013 to 2024.
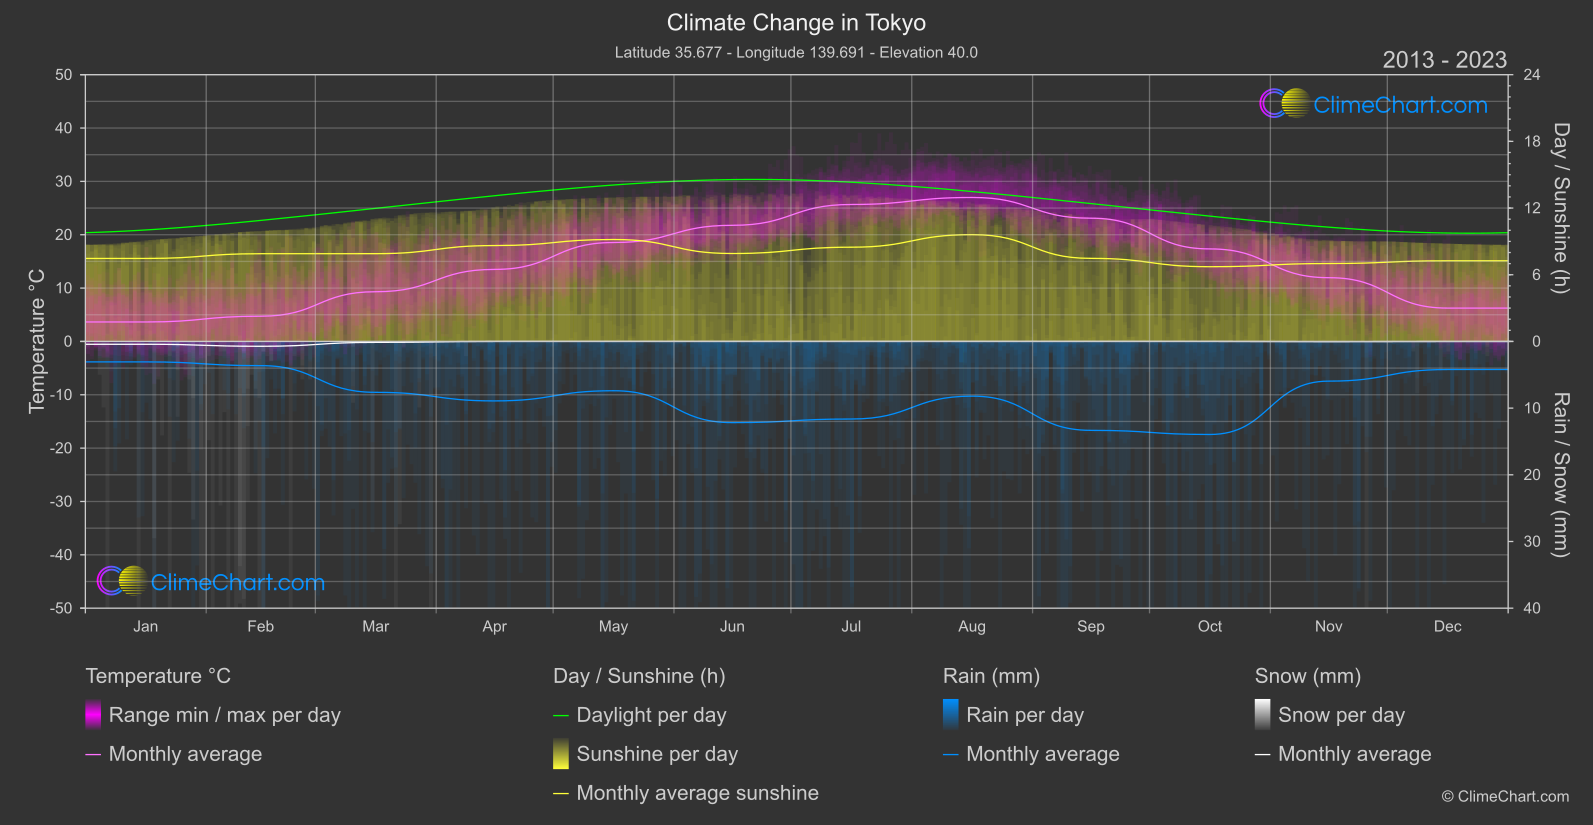
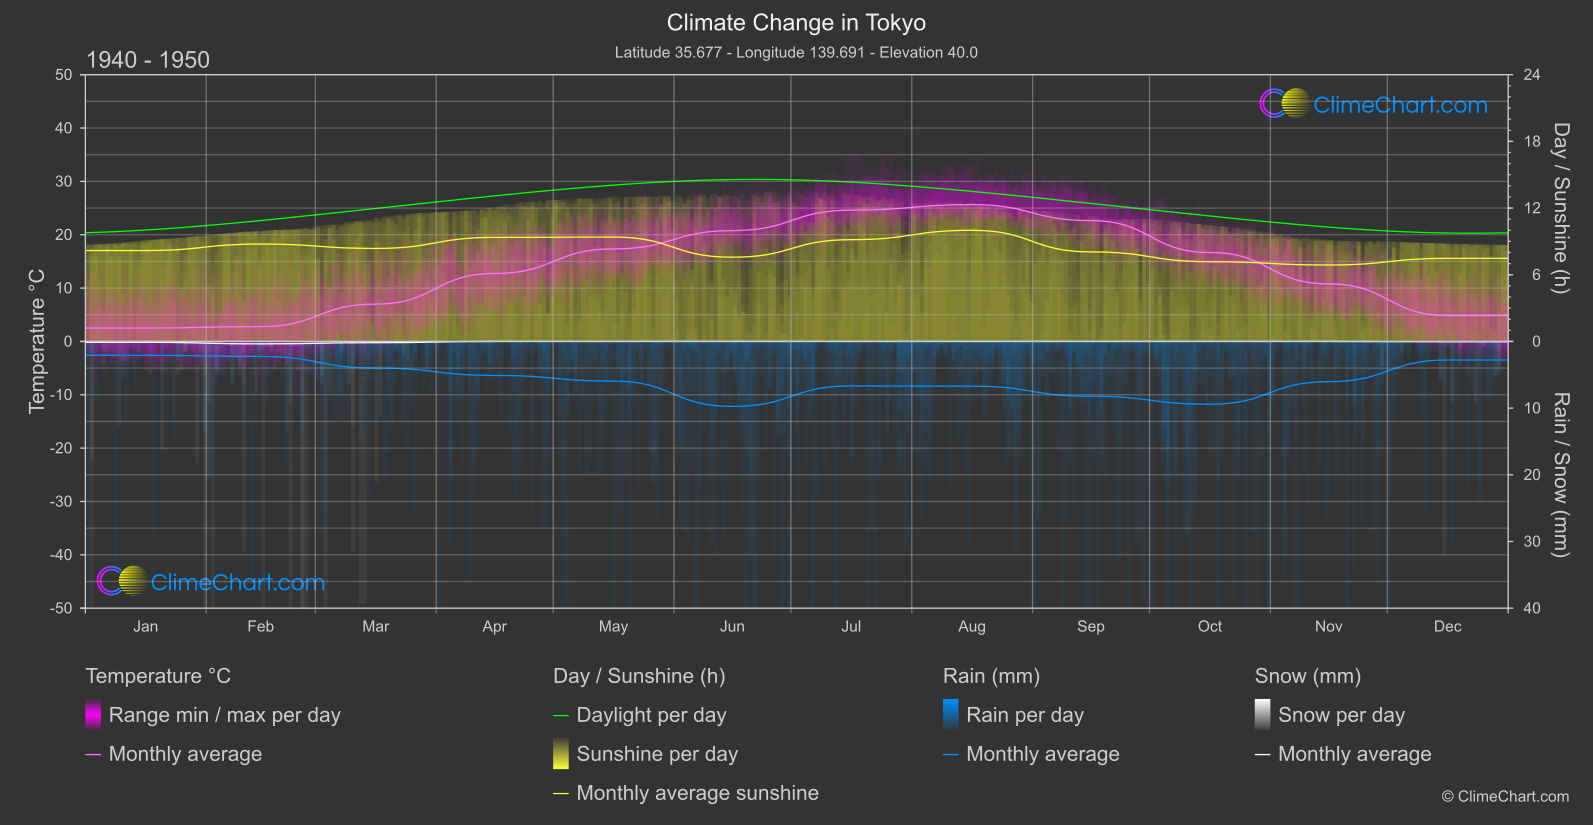
Tokyo, Japan, experiences significant changes in temperature, with the highest increases observed in February and March. Rainfall also shows a notable rise, particularly in September and October. Snowfall has decreased over the years, with minimal to no snow recorded in recent times. Sunshine duration varies across months, with a noticeable drop in sunshine hours during the summer months.
Climate Change Data Overview for Tokyo, Japan
Explore the comprehensive climate change data for Tokyo, Japan. This detailed table provides valuable insights into temperature variations, precipitation levels, and seasonal changes influenced by climate change, helping you understand the unique weather patterns of this region.
Temperature °C
| Month | ⌀ 1940 - 1950 | ⌀ 2013 - 2023 | +/- |
|---|---|---|---|
| Jan | 2.51 | 3.65 | 1.14 |
| Feb | 2.78 | 4.73 | 1.95 |
| Mar | 7.00 | 9.32 | 2.32 |
| Apr | 12.74 | 13.50 | 0.76 |
| May | 17.34 | 18.54 | 1.20 |
| Jun | 20.77 | 21.77 | 0.99 |
| Jul | 24.60 | 25.67 | 1.07 |
| Aug | 25.65 | 26.99 | 1.34 |
| Sep | 22.64 | 23.10 | 0.46 |
| Oct | 16.67 | 17.34 | 0.67 |
| Nov | 10.79 | 11.95 | 1.16 |
| Dec | 4.86 | 6.25 | 1.39 |
| ⌀ Month | 14.03 | 15.23 | 1.20 |
Sunshine (h)
| Month | ⌀ 1940 - 1950 | ⌀ 2013 - 2023 | +/- |
|---|---|---|---|
| Jan | 8.18 | 7.47 | -0.71 |
| Feb | 8.76 | 7.89 | -0.87 |
| Mar | 8.37 | 7.90 | -0.47 |
| Apr | 9.36 | 8.63 | -0.74 |
| May | 9.39 | 9.17 | -0.22 |
| Jun | 7.58 | 7.91 | 0.33 |
| Jul | 9.16 | 8.48 | -0.68 |
| Aug | 10.00 | 9.61 | -0.39 |
| Sep | 8.06 | 7.47 | -0.58 |
| Oct | 7.17 | 6.72 | -0.45 |
| Nov | 6.88 | 7.01 | 0.13 |
| Dec | 7.47 | 7.26 | -0.22 |
| ⌀ Month | 8.36 | 7.96 | -0.40 |
Rain (mm)
| Month | ⌀ 1940 - 1950 | ⌀ 2013 - 2023 | +/- |
|---|---|---|---|
| Jan | 1.04 | 1.53 | 0.49 |
| Feb | 1.13 | 1.82 | 0.69 |
| Mar | 1.99 | 3.82 | 1.82 |
| Apr | 2.55 | 4.46 | 1.91 |
| May | 2.98 | 3.70 | 0.72 |
| Jun | 4.87 | 6.09 | 1.22 |
| Jul | 3.33 | 5.82 | 2.49 |
| Aug | 3.36 | 4.10 | 0.74 |
| Sep | 4.11 | 6.67 | 2.56 |
| Oct | 4.71 | 6.98 | 2.27 |
| Nov | 3.02 | 2.98 | -0.04 |
| Dec | 1.39 | 2.11 | 0.72 |
| ⌀ Month | 2.87 | 4.17 | 1.30 |
Snow (mm)
| Month | ⌀ 1940 - 1950 | ⌀ 2013 - 2023 | +/- |
|---|---|---|---|
| Jan | 0.07 | 0.21 | 0.15 |
| Feb | 0.18 | 0.36 | 0.18 |
| Mar | 0.09 | 0.07 | -0.02 |
| Apr | 0.00 | 0.00 | 0.00 |
| May | 0.00 | 0.00 | 0.00 |
| Jun | 0.00 | 0.00 | 0.00 |
| Jul | 0.00 | 0.00 | 0.00 |
| Aug | 0.00 | 0.00 | 0.00 |
| Sep | 0.00 | 0.00 | 0.00 |
| Oct | 0.00 | 0.00 | 0.00 |
| Nov | 0.00 | 0.02 | 0.02 |
| Dec | 0.02 | 0.01 | -0.02 |
| ⌀ Month | 0.03 | 0.06 | 0.03 |