Climate Change Chart of Tignes, France
Comprehensive Climate Change Chart of Tignes, France: Monthly Averages and Impact Trends
Explore the changing climate in Tignes, France with insights from temperature, rainfall, snowfall, and sunshine duration data. Discover the impact of climate change on this picturesque location.
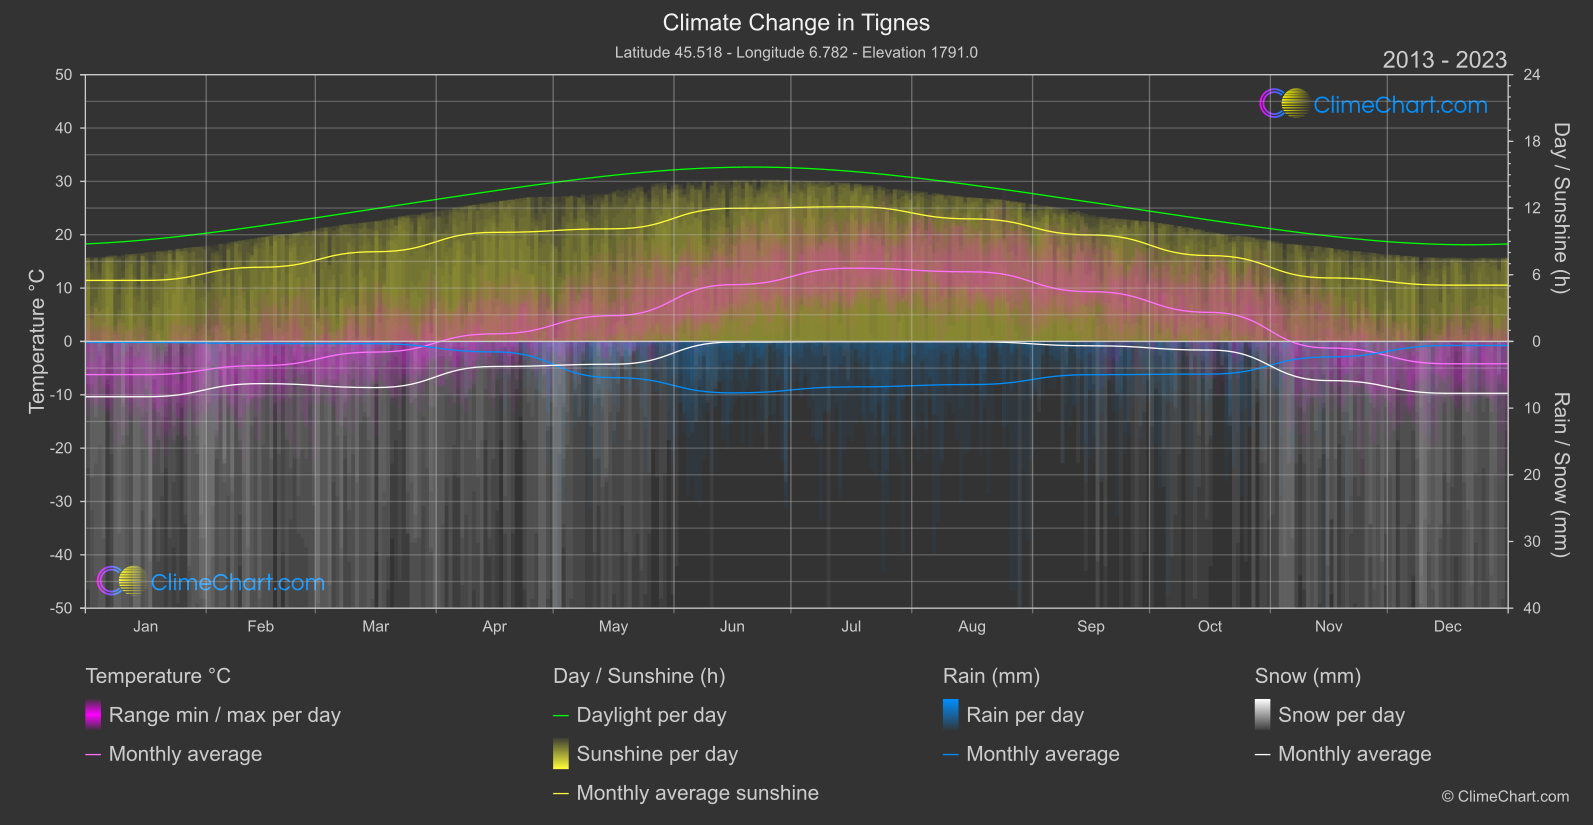
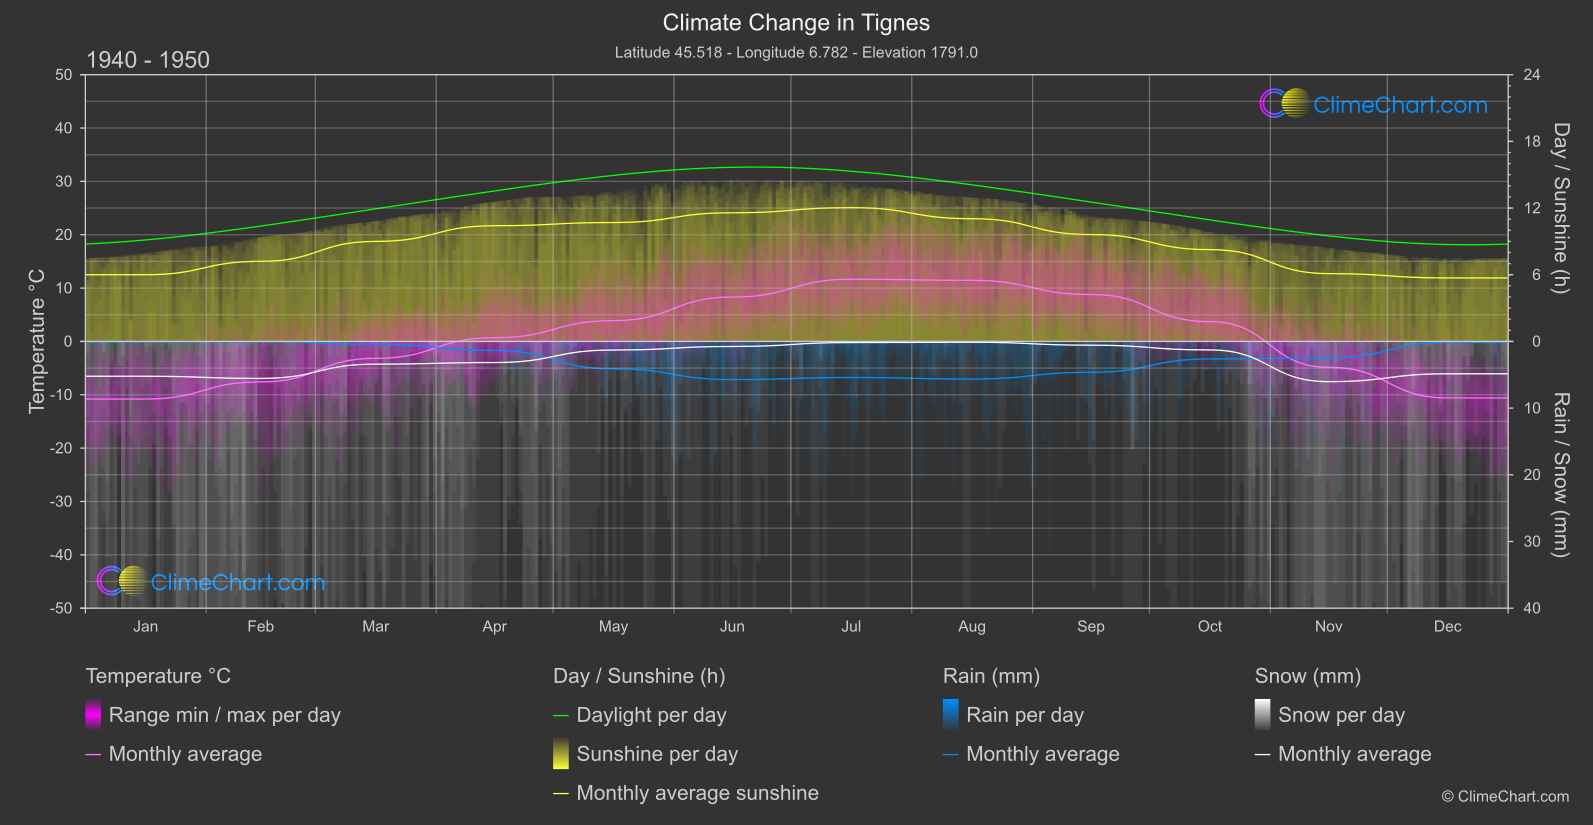
Tignes, a commune in southeastern France, has experienced significant changes in climate over the years. From the 1940s to the 1950s compared to 2013 to 2024, the data shows varying trends in temperature, rainfall, snowfall, and sunshine duration. One interesting insight is the month of December, with a substantial increase in temperature and snowfall, indicating a shift in winter conditions. Explore the detailed data to understand the evolving climate patterns in Tignes.
Climate Change Data Overview for Tignes, France
Explore the comprehensive climate change data for Tignes, France. This detailed table provides valuable insights into temperature variations, precipitation levels, and seasonal changes influenced by climate change, helping you understand the unique weather patterns of this region.
Temperature °C
| Month | ⌀ 1940 - 1950 | ⌀ 2013 - 2023 | +/- |
|---|---|---|---|
| Jan | -10.80 | -6.22 | 4.58 |
| Feb | -7.59 | -4.53 | 3.06 |
| Mar | -3.16 | -1.99 | 1.17 |
| Apr | 0.70 | 1.42 | 0.72 |
| May | 3.90 | 4.84 | 0.94 |
| Jun | 8.32 | 10.63 | 2.32 |
| Jul | 11.66 | 13.74 | 2.07 |
| Aug | 11.44 | 13.05 | 1.60 |
| Sep | 8.79 | 9.33 | 0.53 |
| Oct | 3.72 | 5.45 | 1.73 |
| Nov | -4.87 | -1.23 | 3.63 |
| Dec | -10.60 | -4.19 | 6.41 |
| ⌀ Month | 0.96 | 3.36 | 2.40 |
Sunshine (h)
| Month | ⌀ 1940 - 1950 | ⌀ 2013 - 2023 | +/- |
|---|---|---|---|
| Jan | 6.00 | 5.49 | -0.51 |
| Feb | 7.20 | 6.67 | -0.53 |
| Mar | 9.00 | 8.07 | -0.93 |
| Apr | 10.41 | 9.81 | -0.60 |
| May | 10.70 | 10.13 | -0.56 |
| Jun | 11.57 | 11.98 | 0.40 |
| Jul | 12.04 | 12.12 | 0.08 |
| Aug | 11.04 | 11.02 | -0.02 |
| Sep | 9.62 | 9.58 | -0.04 |
| Oct | 8.26 | 7.72 | -0.54 |
| Nov | 6.10 | 5.71 | -0.39 |
| Dec | 5.71 | 5.07 | -0.65 |
| ⌀ Month | 8.97 | 8.62 | -0.36 |
Rain (mm)
| Month | ⌀ 1940 - 1950 | ⌀ 2013 - 2023 | +/- |
|---|---|---|---|
| Jan | 0.04 | 0.08 | 0.04 |
| Feb | 0.03 | 0.16 | 0.12 |
| Mar | 0.21 | 0.17 | -0.04 |
| Apr | 0.68 | 0.78 | 0.11 |
| May | 2.06 | 2.71 | 0.66 |
| Jun | 2.86 | 3.86 | 1.00 |
| Jul | 2.70 | 3.41 | 0.71 |
| Aug | 2.82 | 3.23 | 0.41 |
| Sep | 2.31 | 2.49 | 0.18 |
| Oct | 1.31 | 2.45 | 1.14 |
| Nov | 1.24 | 1.16 | -0.08 |
| Dec | 0.07 | 0.30 | 0.23 |
| ⌀ Month | 1.36 | 1.73 | 0.37 |
Snow (mm)
| Month | ⌀ 1940 - 1950 | ⌀ 2013 - 2023 | +/- |
|---|---|---|---|
| Jan | 2.61 | 4.15 | 1.54 |
| Feb | 2.77 | 3.16 | 0.39 |
| Mar | 1.70 | 3.46 | 1.76 |
| Apr | 1.58 | 1.88 | 0.29 |
| May | 0.64 | 1.71 | 1.07 |
| Jun | 0.38 | 0.05 | -0.33 |
| Jul | 0.08 | 0.02 | -0.07 |
| Aug | 0.06 | 0.03 | -0.04 |
| Sep | 0.28 | 0.33 | 0.05 |
| Oct | 0.64 | 0.65 | 0.01 |
| Nov | 3.02 | 2.93 | -0.08 |
| Dec | 2.43 | 3.89 | 1.46 |
| ⌀ Month | 1.35 | 1.85 | 0.50 |