Climate Change Chart of Thimphu, Bhutan
Comprehensive Climate Change Chart of Thimphu, Bhutan: Monthly Averages and Impact Trends
Explore the changing climate in Thimphu, Bhutan, with insightful data analysis showcasing temperature, rainfall, snowfall, and sunshine duration trends over the years.
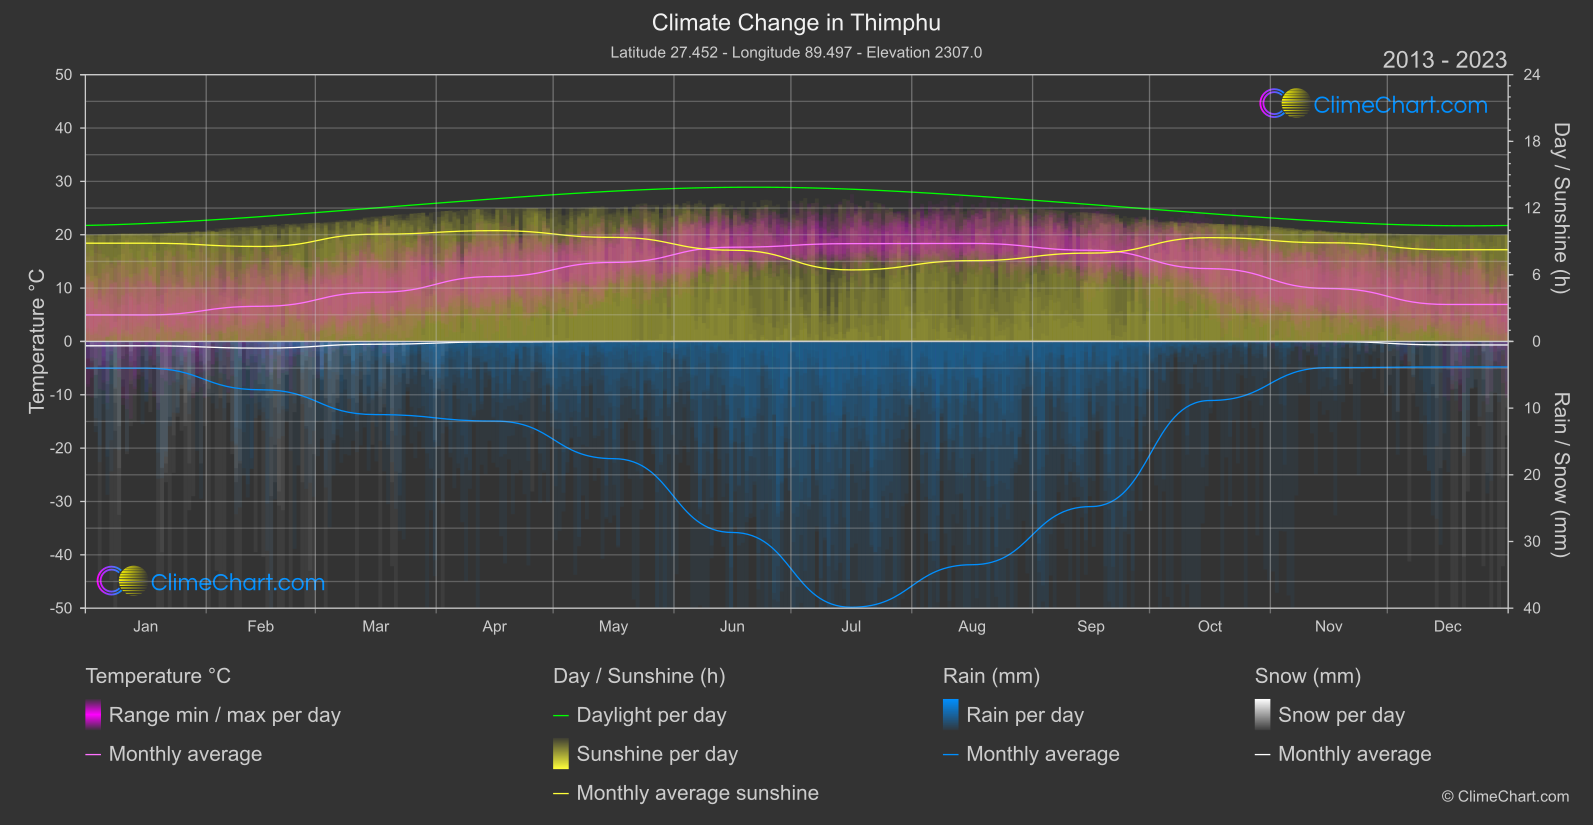
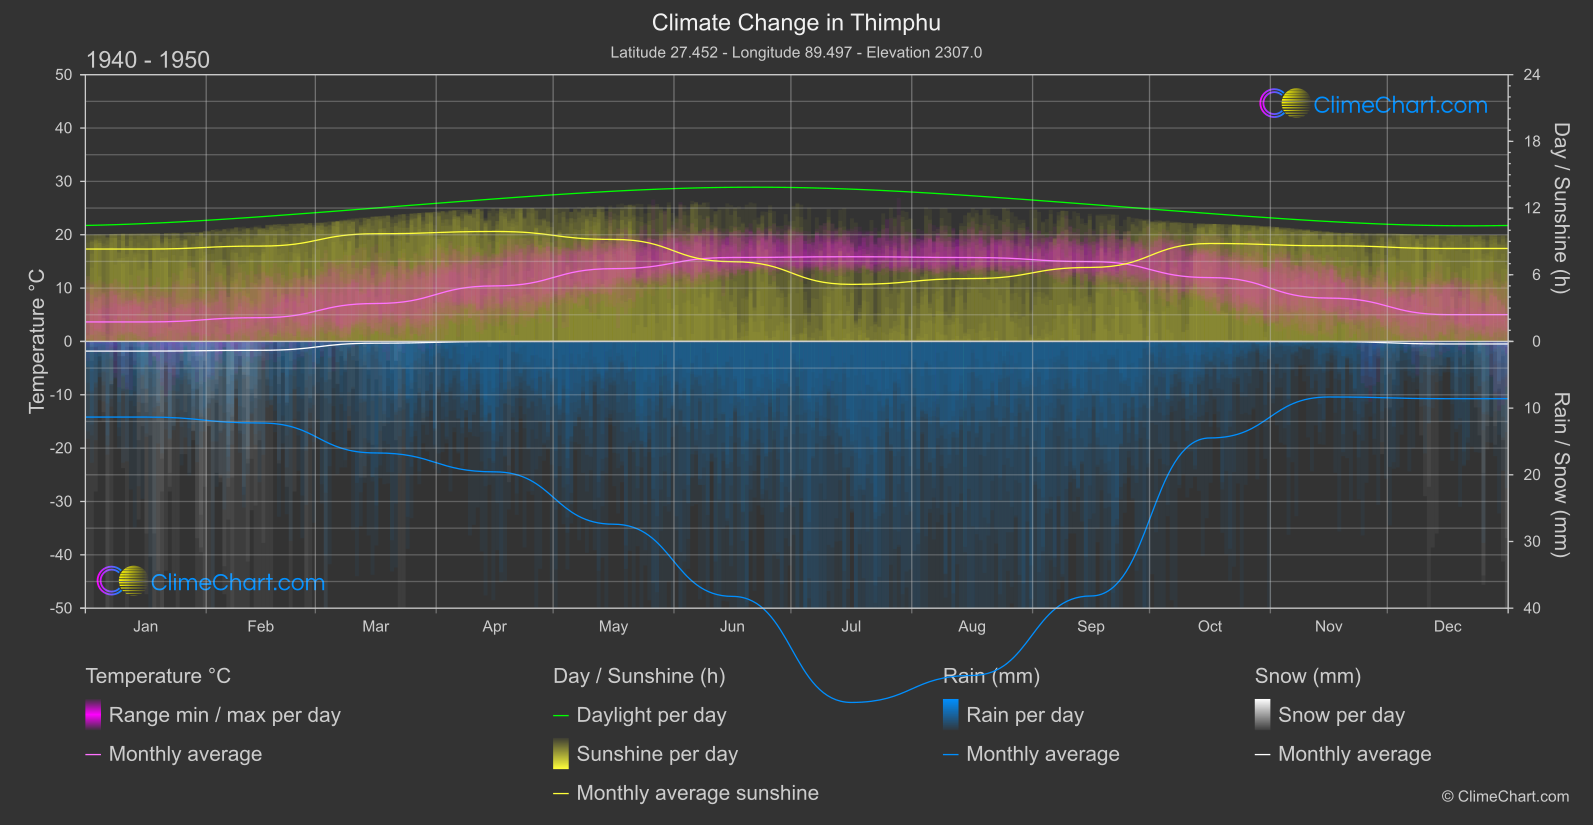
Thimphu, the capital of Bhutan, has been experiencing noticeable changes in its climate patterns. Analyzing the temperature data from 1940 to 1950 compared to 2013 to 2024, we observe significant increases in temperatures across most months, with August showing the highest change of 2.64°C. As for rainfall, the data indicates a decrease in most months, particularly in August with a drop of 8.30mm. Snowfall and sunshine duration also exhibit varying trends over the years, reflecting the evolving climate in Thimphu, Bhutan.
Climate Change Data Overview for Thimphu, Bhutan
Explore the comprehensive climate change data for Thimphu, Bhutan. This detailed table provides valuable insights into temperature variations, precipitation levels, and seasonal changes influenced by climate change, helping you understand the unique weather patterns of this region.
Temperature °C
| Month | ⌀ 1940 - 1950 | ⌀ 2013 - 2023 | +/- |
|---|---|---|---|
| Jan | 3.66 | 4.97 | 1.31 |
| Feb | 4.46 | 6.59 | 2.13 |
| Mar | 7.11 | 9.21 | 2.10 |
| Apr | 10.41 | 12.16 | 1.76 |
| May | 13.64 | 14.81 | 1.17 |
| Jun | 15.74 | 17.66 | 1.93 |
| Jul | 15.88 | 18.33 | 2.46 |
| Aug | 15.73 | 18.37 | 2.64 |
| Sep | 14.96 | 17.09 | 2.13 |
| Oct | 11.97 | 13.65 | 1.68 |
| Nov | 8.12 | 9.93 | 1.80 |
| Dec | 5.02 | 6.93 | 1.91 |
| ⌀ Month | 10.56 | 12.47 | 1.92 |
Sunshine (h)
| Month | ⌀ 1940 - 1950 | ⌀ 2013 - 2023 | +/- |
|---|---|---|---|
| Jan | 8.31 | 8.84 | 0.52 |
| Feb | 8.58 | 8.54 | -0.04 |
| Mar | 9.69 | 9.65 | -0.04 |
| Apr | 9.89 | 9.97 | 0.07 |
| May | 9.18 | 9.36 | 0.18 |
| Jun | 7.18 | 8.21 | 1.03 |
| Jul | 5.13 | 6.44 | 1.30 |
| Aug | 5.66 | 7.27 | 1.61 |
| Sep | 6.66 | 7.95 | 1.29 |
| Oct | 8.81 | 9.34 | 0.53 |
| Nov | 8.61 | 8.87 | 0.27 |
| Dec | 8.36 | 8.25 | -0.11 |
| ⌀ Month | 8.01 | 8.56 | 0.55 |
Rain (mm)
| Month | ⌀ 1940 - 1950 | ⌀ 2013 - 2023 | +/- |
|---|---|---|---|
| Jan | 5.67 | 2.00 | -3.67 |
| Feb | 6.12 | 3.62 | -2.49 |
| Mar | 8.36 | 5.49 | -2.88 |
| Apr | 9.78 | 5.97 | -3.81 |
| May | 13.70 | 8.79 | -4.91 |
| Jun | 19.12 | 14.32 | -4.79 |
| Jul | 27.07 | 19.93 | -7.14 |
| Aug | 25.05 | 16.74 | -8.30 |
| Sep | 19.08 | 12.38 | -6.70 |
| Oct | 7.24 | 4.43 | -2.81 |
| Nov | 4.16 | 1.96 | -2.20 |
| Dec | 4.29 | 1.91 | -2.38 |
| ⌀ Month | 12.47 | 8.13 | -4.34 |
Snow (mm)
| Month | ⌀ 1940 - 1950 | ⌀ 2013 - 2023 | +/- |
|---|---|---|---|
| Jan | 0.72 | 0.33 | -0.40 |
| Feb | 0.67 | 0.50 | -0.16 |
| Mar | 0.13 | 0.21 | 0.08 |
| Apr | 0.01 | 0.04 | 0.03 |
| May | 0.00 | 0.00 | 0.00 |
| Jun | 0.00 | 0.00 | 0.00 |
| Jul | 0.00 | 0.00 | 0.00 |
| Aug | 0.00 | 0.00 | 0.00 |
| Sep | 0.00 | 0.00 | 0.00 |
| Oct | 0.00 | 0.00 | 0.00 |
| Nov | 0.01 | 0.01 | -0.00 |
| Dec | 0.19 | 0.26 | 0.07 |
| ⌀ Month | 0.14 | 0.11 | -0.03 |