Climate Change Chart of Telluride, USA
Comprehensive Climate Change Chart of Telluride, USA: Monthly Averages and Impact Trends
Exploring the changing climate in Telluride, United States of America reveals intriguing patterns in temperature, rainfall, snowfall, and sunshine duration. Dive into the data to uncover how the climate has evolved over the years.
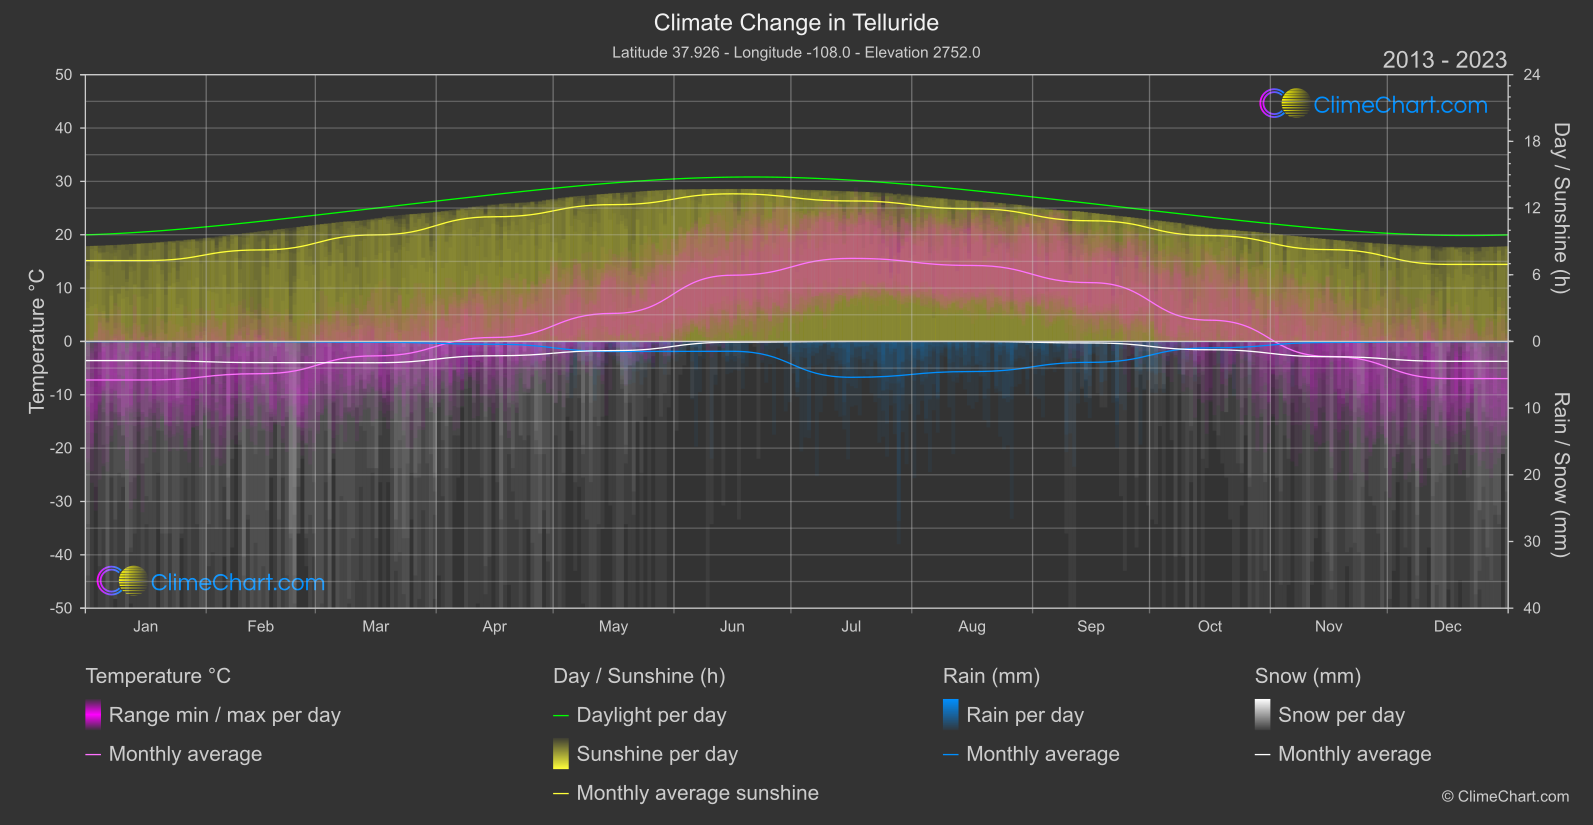
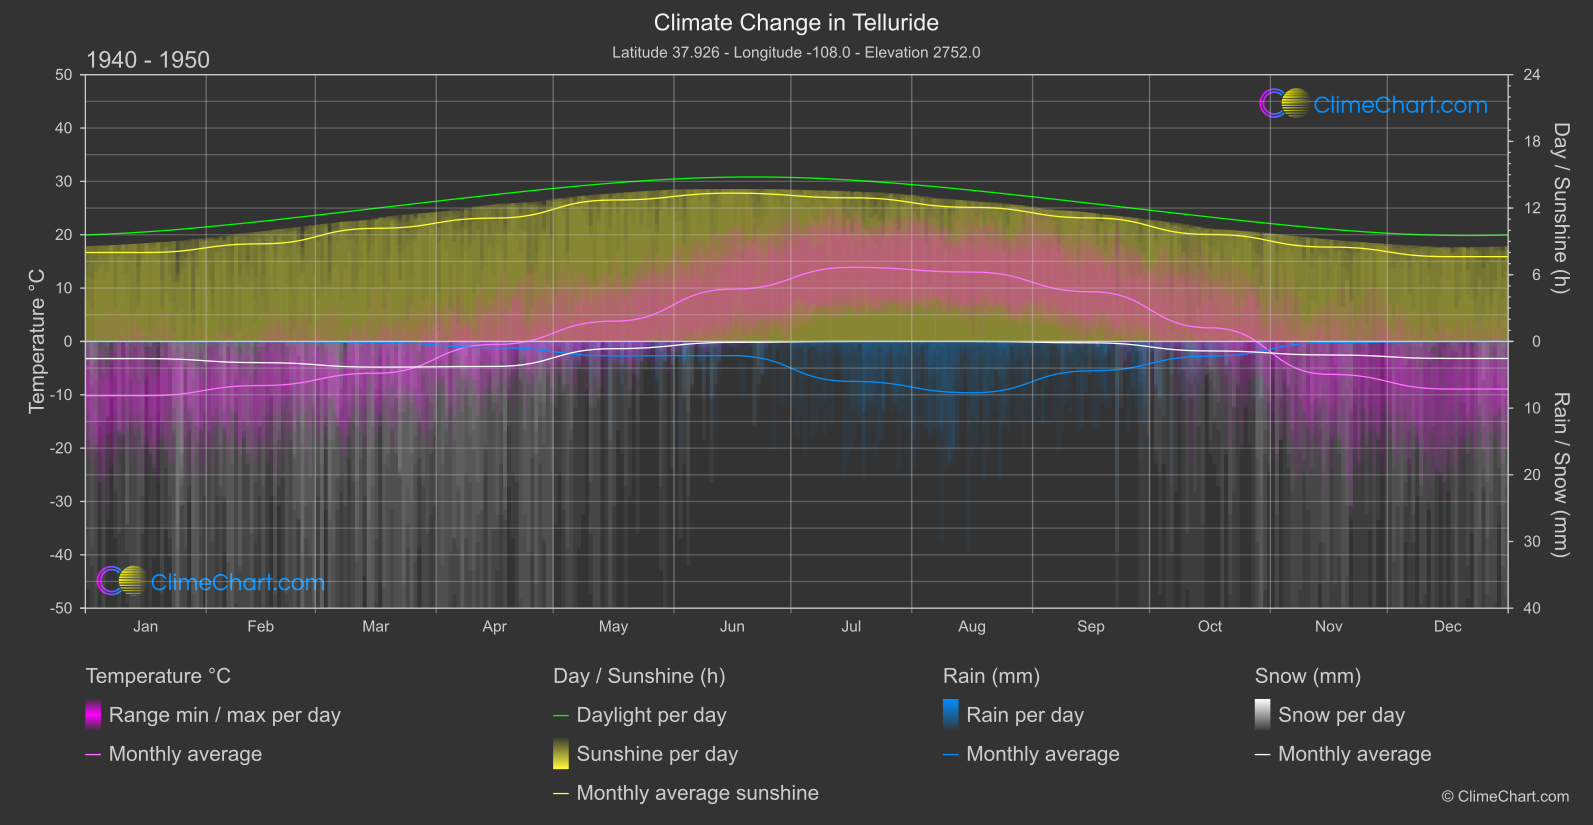
Telluride, located in the United States of America, has witnessed significant changes in its climate over the years. Analyzing the data reveals interesting insights into temperature variations, rainfall patterns, snowfall amounts, and sunshine duration. From the coldest months of January and February to the warmer months of June and July, the trends in temperature shifts are noticeable. Rainfall and snowfall also exhibit fluctuations, impacting the overall weather patterns in Telluride. Understanding these climate changes is crucial for adapting to the evolving environment and mitigating potential risks.
Climate Change Data Overview for Telluride, USA
Explore the comprehensive climate change data for Telluride, USA. This detailed table provides valuable insights into temperature variations, precipitation levels, and seasonal changes influenced by climate change, helping you understand the unique weather patterns of this region.
Temperature °C
| Month | ⌀ 1940 - 1950 | ⌀ 2013 - 2023 | +/- |
|---|---|---|---|
| Jan | -10.17 | -7.22 | 2.95 |
| Feb | -8.27 | -6.04 | 2.23 |
| Mar | -5.96 | -2.70 | 3.25 |
| Apr | -0.57 | 0.75 | 1.32 |
| May | 3.81 | 5.26 | 1.45 |
| Jun | 9.80 | 12.41 | 2.61 |
| Jul | 13.89 | 15.57 | 1.68 |
| Aug | 13.00 | 14.24 | 1.24 |
| Sep | 9.31 | 11.02 | 1.71 |
| Oct | 2.55 | 3.98 | 1.43 |
| Nov | -6.17 | -2.81 | 3.36 |
| Dec | -8.92 | -6.96 | 1.97 |
| ⌀ Month | 1.03 | 3.12 | 2.10 |
Sunshine (h)
| Month | ⌀ 1940 - 1950 | ⌀ 2013 - 2023 | +/- |
|---|---|---|---|
| Jan | 8.00 | 7.28 | -0.72 |
| Feb | 8.78 | 8.23 | -0.55 |
| Mar | 10.18 | 9.59 | -0.59 |
| Apr | 11.10 | 11.22 | 0.12 |
| May | 12.72 | 12.31 | -0.41 |
| Jun | 13.34 | 13.28 | -0.06 |
| Jul | 12.92 | 12.64 | -0.28 |
| Aug | 12.06 | 11.94 | -0.12 |
| Sep | 11.11 | 10.86 | -0.26 |
| Oct | 9.62 | 9.52 | -0.10 |
| Nov | 8.49 | 8.26 | -0.23 |
| Dec | 7.63 | 6.93 | -0.70 |
| ⌀ Month | 10.50 | 10.17 | -0.33 |
Rain (mm)
| Month | ⌀ 1940 - 1950 | ⌀ 2013 - 2023 | +/- |
|---|---|---|---|
| Jan | 0.01 | 0.01 | -0.00 |
| Feb | 0.01 | 0.02 | 0.01 |
| Mar | 0.06 | 0.06 | 0.00 |
| Apr | 0.47 | 0.21 | -0.26 |
| May | 1.08 | 0.75 | -0.33 |
| Jun | 1.06 | 0.74 | -0.32 |
| Jul | 3.00 | 2.69 | -0.31 |
| Aug | 3.85 | 2.26 | -1.59 |
| Sep | 2.20 | 1.57 | -0.64 |
| Oct | 1.11 | 0.48 | -0.62 |
| Nov | 0.08 | 0.08 | -0.01 |
| Dec | 0.01 | 0.01 | 0.00 |
| ⌀ Month | 1.08 | 0.74 | -0.34 |
Snow (mm)
| Month | ⌀ 1940 - 1950 | ⌀ 2013 - 2023 | +/- |
|---|---|---|---|
| Jan | 1.29 | 1.44 | 0.15 |
| Feb | 1.59 | 1.59 | -0.00 |
| Mar | 1.93 | 1.60 | -0.33 |
| Apr | 1.88 | 1.07 | -0.80 |
| May | 0.54 | 0.69 | 0.14 |
| Jun | 0.07 | 0.06 | -0.01 |
| Jul | 0.00 | 0.00 | 0.00 |
| Aug | 0.00 | 0.00 | 0.00 |
| Sep | 0.10 | 0.11 | 0.01 |
| Oct | 0.71 | 0.62 | -0.09 |
| Nov | 1.02 | 1.15 | 0.13 |
| Dec | 1.27 | 1.49 | 0.21 |
| ⌀ Month | 0.87 | 0.82 | -0.05 |