Climate Change Chart of Tegucigalpa, Honduras
Comprehensive Climate Change Chart of Tegucigalpa, Honduras: Monthly Averages and Impact Trends
Explore the changing climate in Tegucigalpa, Honduras, with insights from temperature, rainfall, and sunshine duration data. Discover how the climate has evolved over the years and the impacts on the local environment.
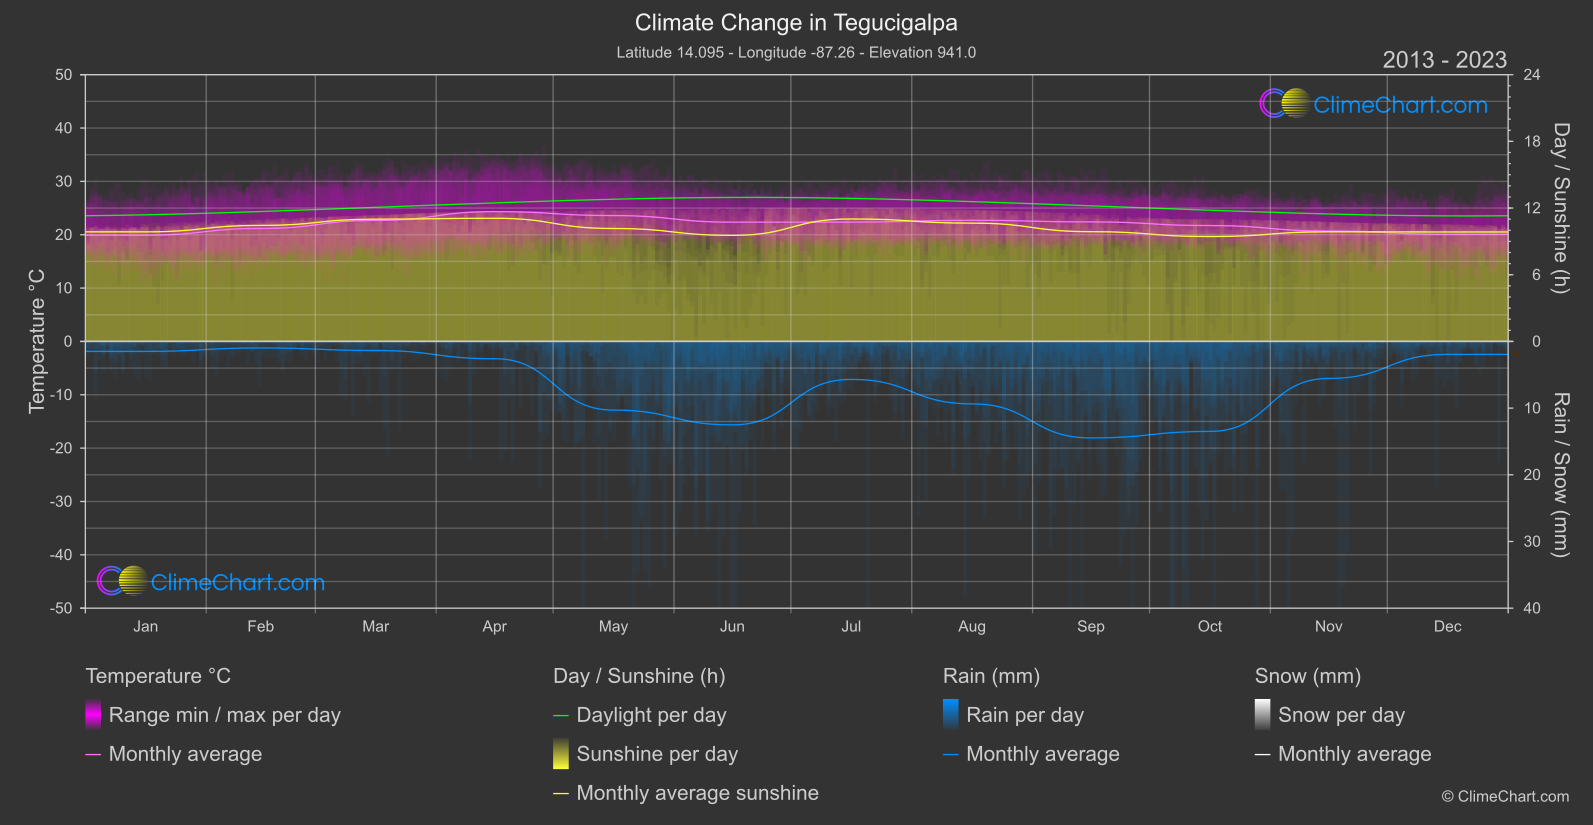
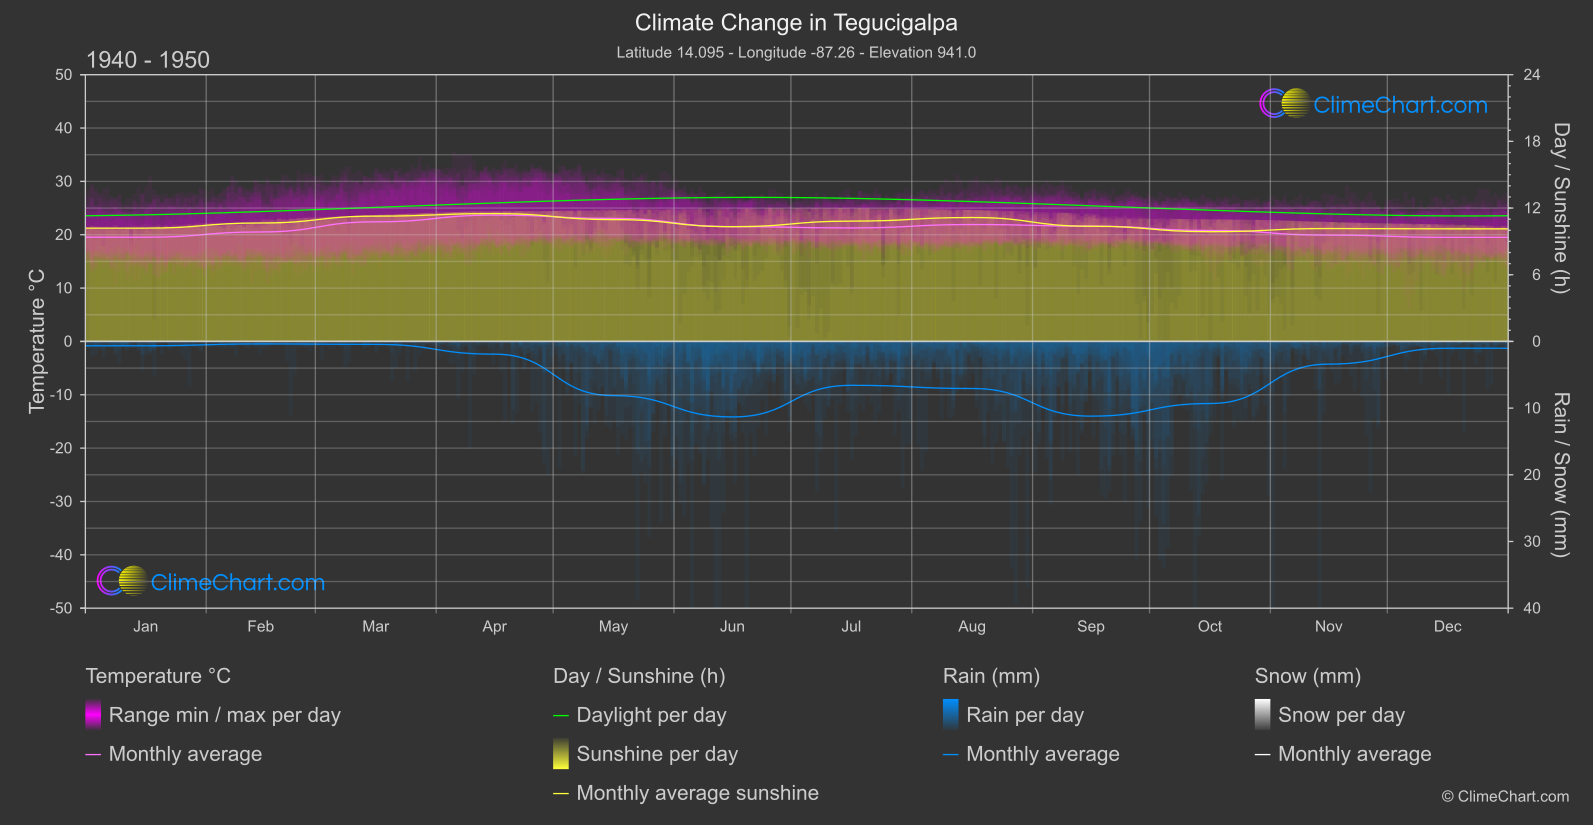
Tegucigalpa, the capital city of Honduras, experiences significant changes in temperature, rainfall, and sunshine duration over the years. Analyzing the data from 1940 to 1950 and comparing it to the period of 2013 to 2024 reveals interesting insights. The month with the highest change in temperature is July, with a remarkable increase of 1.09°C. On the other hand, the month with the most significant rise in rainfall is September, showing a substantial increase of 1.63 mm. Additionally, the month with the largest decrease in sunshine duration is June, with a reduction of 0.78 hours of sunlight.
Climate Change Data Overview for Tegucigalpa, Honduras
Explore the comprehensive climate change data for Tegucigalpa, Honduras. This detailed table provides valuable insights into temperature variations, precipitation levels, and seasonal changes influenced by climate change, helping you understand the unique weather patterns of this region.
Temperature °C
| Month | ⌀ 1940 - 1950 | ⌀ 2013 - 2023 | +/- |
|---|---|---|---|
| Jan | 19.54 | 19.91 | 0.38 |
| Feb | 20.52 | 21.17 | 0.65 |
| Mar | 22.42 | 22.68 | 0.26 |
| Apr | 23.68 | 24.33 | 0.65 |
| May | 23.06 | 23.59 | 0.54 |
| Jun | 21.52 | 22.35 | 0.83 |
| Jul | 21.27 | 22.36 | 1.09 |
| Aug | 21.91 | 22.70 | 0.79 |
| Sep | 21.61 | 22.40 | 0.79 |
| Oct | 20.80 | 21.72 | 0.92 |
| Nov | 19.93 | 20.69 | 0.76 |
| Dec | 19.51 | 20.07 | 0.56 |
| ⌀ Month | 21.31 | 22.00 | 0.69 |
Sunshine (h)
| Month | ⌀ 1940 - 1950 | ⌀ 2013 - 2023 | +/- |
|---|---|---|---|
| Jan | 10.19 | 9.86 | -0.34 |
| Feb | 10.66 | 10.44 | -0.22 |
| Mar | 11.27 | 11.00 | -0.27 |
| Apr | 11.50 | 11.08 | -0.42 |
| May | 10.96 | 10.16 | -0.80 |
| Jun | 10.32 | 9.54 | -0.78 |
| Jul | 10.82 | 11.02 | 0.19 |
| Aug | 11.15 | 10.64 | -0.50 |
| Sep | 10.36 | 9.88 | -0.49 |
| Oct | 9.87 | 9.44 | -0.44 |
| Nov | 10.16 | 9.86 | -0.29 |
| Dec | 10.13 | 9.85 | -0.28 |
| ⌀ Month | 10.62 | 10.23 | -0.39 |
Rain (mm)
| Month | ⌀ 1940 - 1950 | ⌀ 2013 - 2023 | +/- |
|---|---|---|---|
| Jan | 0.33 | 0.75 | 0.42 |
| Feb | 0.19 | 0.49 | 0.30 |
| Mar | 0.22 | 0.68 | 0.46 |
| Apr | 0.96 | 1.30 | 0.34 |
| May | 4.06 | 5.15 | 1.08 |
| Jun | 5.66 | 6.26 | 0.60 |
| Jul | 3.29 | 2.85 | -0.44 |
| Aug | 3.53 | 4.68 | 1.15 |
| Sep | 5.60 | 7.24 | 1.63 |
| Oct | 4.66 | 6.75 | 2.09 |
| Nov | 1.70 | 2.78 | 1.07 |
| Dec | 0.51 | 0.97 | 0.46 |
| ⌀ Month | 2.56 | 3.32 | 0.76 |
Snow (mm)
| Month | ⌀ 1940 - 1950 | ⌀ 2013 - 2023 | +/- |
|---|---|---|---|
| Jan | 0.00 | 0.00 | 0.00 |
| Feb | 0.00 | 0.00 | 0.00 |
| Mar | 0.00 | 0.00 | 0.00 |
| Apr | 0.00 | 0.00 | 0.00 |
| May | 0.00 | 0.00 | 0.00 |
| Jun | 0.00 | 0.00 | 0.00 |
| Jul | 0.00 | 0.00 | 0.00 |
| Aug | 0.00 | 0.00 | 0.00 |
| Sep | 0.00 | 0.00 | 0.00 |
| Oct | 0.00 | 0.00 | 0.00 |
| Nov | 0.00 | 0.00 | 0.00 |
| Dec | 0.00 | 0.00 | 0.00 |
| ⌀ Month | 0.00 | 0.00 | 0.00 |