Climate Change Chart of Tallinn, Estonia
Comprehensive Climate Change Chart of Tallinn, Estonia: Monthly Averages and Impact Trends
Explore the changing climate in Tallinn, Estonia with insightful data analysis. Discover how temperature, rainfall, snowfall, and sunshine duration have evolved over the years.
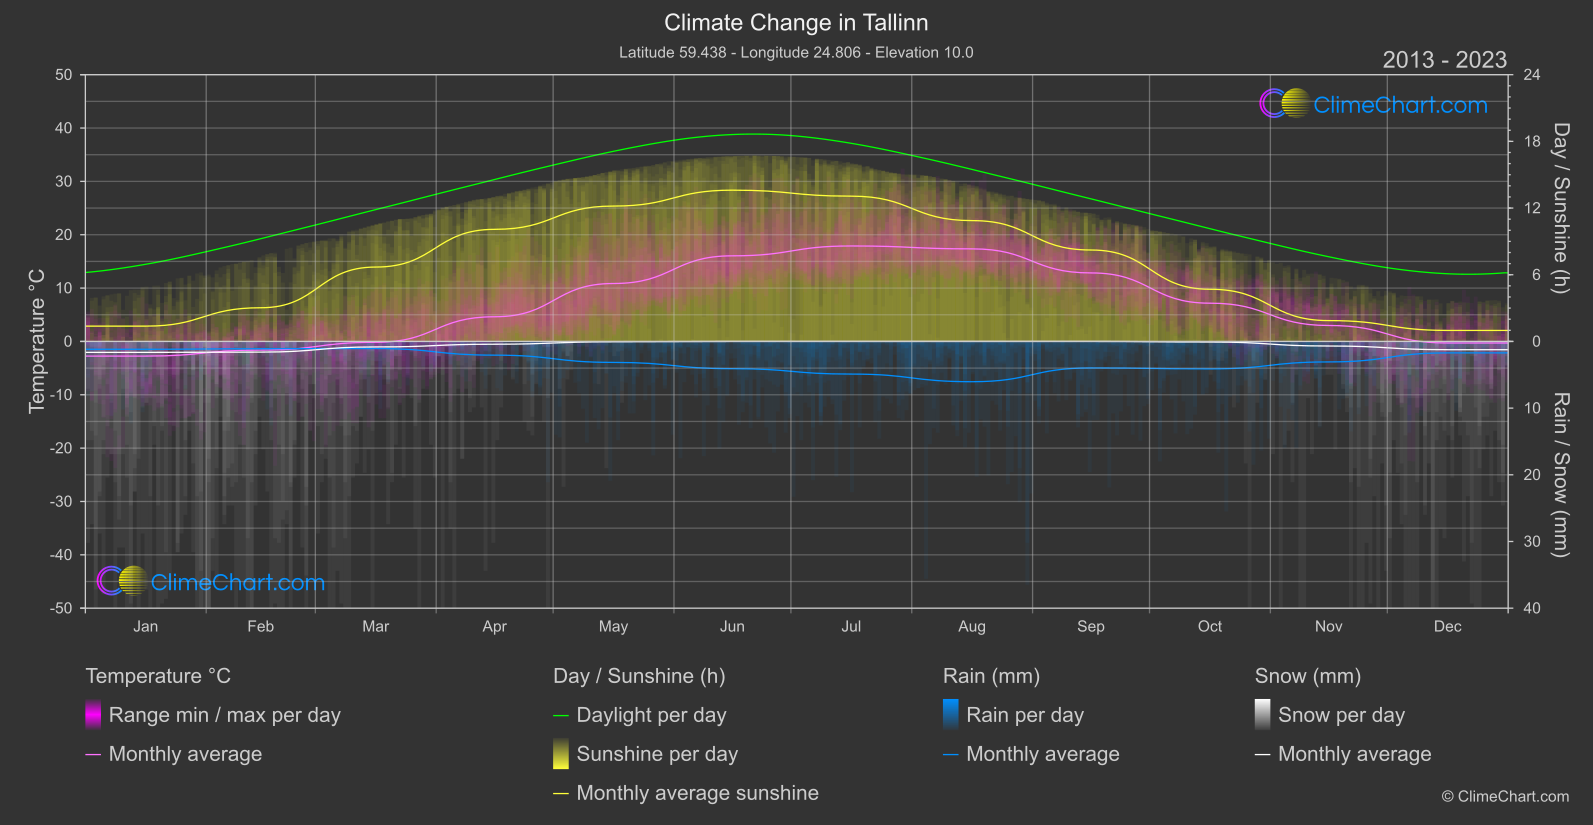
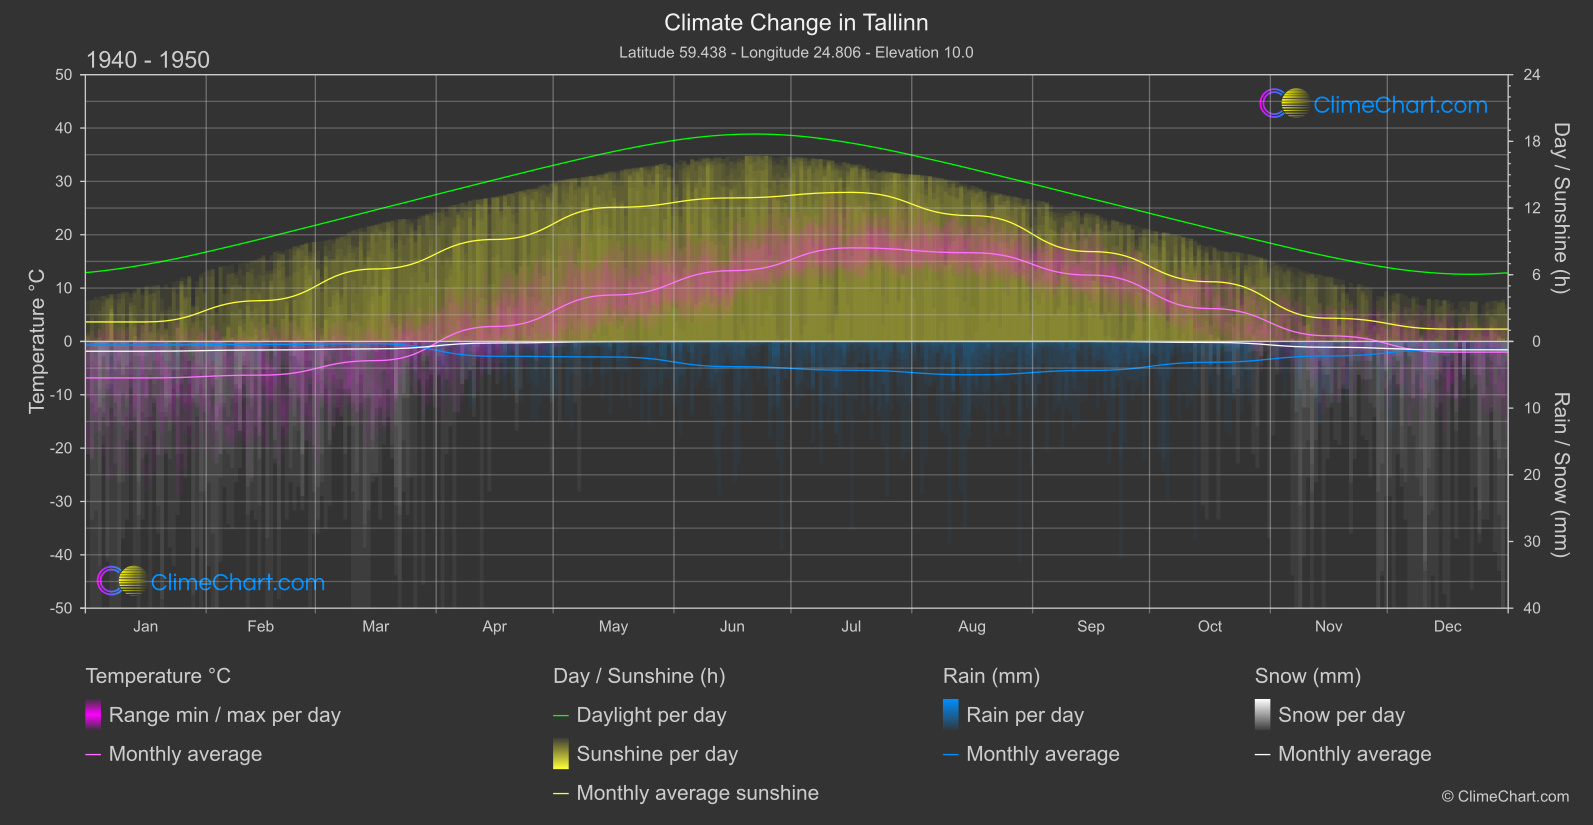
Delve deeper into the climate and weather trends in Tallinn, Estonia. Analyzing the data from 1940 to 1950 and comparing it to 2013 to 2024, we observe significant changes in temperature, rainfall, snowfall, and sunshine duration. Notable findings include the increase in winter temperatures, varying rainfall patterns, decreasing snowfall levels, and fluctuating sunshine hours. Explore the detailed insights provided for each month to gain a comprehensive understanding of how climate change has impacted Tallinn over the years.
Climate Change Data Overview for Tallinn, Estonia
Explore the comprehensive climate change data for Tallinn, Estonia. This detailed table provides valuable insights into temperature variations, precipitation levels, and seasonal changes influenced by climate change, helping you understand the unique weather patterns of this region.
Temperature °C
| Month | ⌀ 1940 - 1950 | ⌀ 2013 - 2023 | +/- |
|---|---|---|---|
| Jan | -6.84 | -2.75 | 4.10 |
| Feb | -6.32 | -1.62 | 4.70 |
| Mar | -3.59 | -0.16 | 3.43 |
| Apr | 2.81 | 4.63 | 1.82 |
| May | 8.70 | 10.86 | 2.16 |
| Jun | 13.26 | 16.05 | 2.79 |
| Jul | 17.54 | 17.89 | 0.35 |
| Aug | 16.62 | 17.35 | 0.73 |
| Sep | 12.42 | 12.84 | 0.42 |
| Oct | 6.16 | 7.17 | 1.01 |
| Nov | 1.05 | 2.99 | 1.94 |
| Dec | -2.00 | -0.29 | 1.71 |
| ⌀ Month | 4.98 | 7.08 | 2.09 |
Sunshine (h)
| Month | ⌀ 1940 - 1950 | ⌀ 2013 - 2023 | +/- |
|---|---|---|---|
| Jan | 1.75 | 1.38 | -0.38 |
| Feb | 3.67 | 3.03 | -0.64 |
| Mar | 6.52 | 6.69 | 0.17 |
| Apr | 9.18 | 10.09 | 0.91 |
| May | 12.06 | 12.18 | 0.12 |
| Jun | 12.91 | 13.61 | 0.70 |
| Jul | 13.41 | 13.07 | -0.34 |
| Aug | 11.32 | 10.87 | -0.45 |
| Sep | 8.08 | 8.23 | 0.14 |
| Oct | 5.37 | 4.70 | -0.68 |
| Nov | 2.09 | 1.87 | -0.22 |
| Dec | 1.11 | 0.99 | -0.12 |
| ⌀ Month | 7.29 | 7.23 | -0.06 |
Rain (mm)
| Month | ⌀ 1940 - 1950 | ⌀ 2013 - 2023 | +/- |
|---|---|---|---|
| Jan | 0.26 | 0.59 | 0.32 |
| Feb | 0.23 | 0.55 | 0.32 |
| Mar | 0.17 | 0.53 | 0.36 |
| Apr | 1.11 | 1.03 | -0.08 |
| May | 1.17 | 1.57 | 0.40 |
| Jun | 1.89 | 2.04 | 0.15 |
| Jul | 2.16 | 2.45 | 0.29 |
| Aug | 2.50 | 3.02 | 0.52 |
| Sep | 2.17 | 1.99 | -0.19 |
| Oct | 1.56 | 2.06 | 0.49 |
| Nov | 1.09 | 1.54 | 0.44 |
| Dec | 0.60 | 0.86 | 0.26 |
| ⌀ Month | 1.24 | 1.52 | 0.27 |
Snow (mm)
| Month | ⌀ 1940 - 1950 | ⌀ 2013 - 2023 | +/- |
|---|---|---|---|
| Jan | 0.73 | 0.82 | 0.09 |
| Feb | 0.64 | 0.80 | 0.16 |
| Mar | 0.56 | 0.41 | -0.14 |
| Apr | 0.12 | 0.21 | 0.09 |
| May | 0.01 | 0.03 | 0.01 |
| Jun | 0.00 | 0.00 | 0.00 |
| Jul | 0.00 | 0.00 | 0.00 |
| Aug | 0.00 | 0.00 | 0.00 |
| Sep | 0.00 | 0.00 | 0.00 |
| Oct | 0.07 | 0.04 | -0.03 |
| Nov | 0.44 | 0.34 | -0.09 |
| Dec | 0.63 | 0.62 | -0.01 |
| ⌀ Month | 0.27 | 0.27 | 0.01 |