Climate Change Chart of Tallahassee, USA
Comprehensive Climate Change Chart of Tallahassee, USA: Monthly Averages and Impact Trends
Explore the changing climate in Tallahassee, USA through insightful data analysis. Discover the trends and shifts in temperature, rainfall, and sunshine duration over the years.
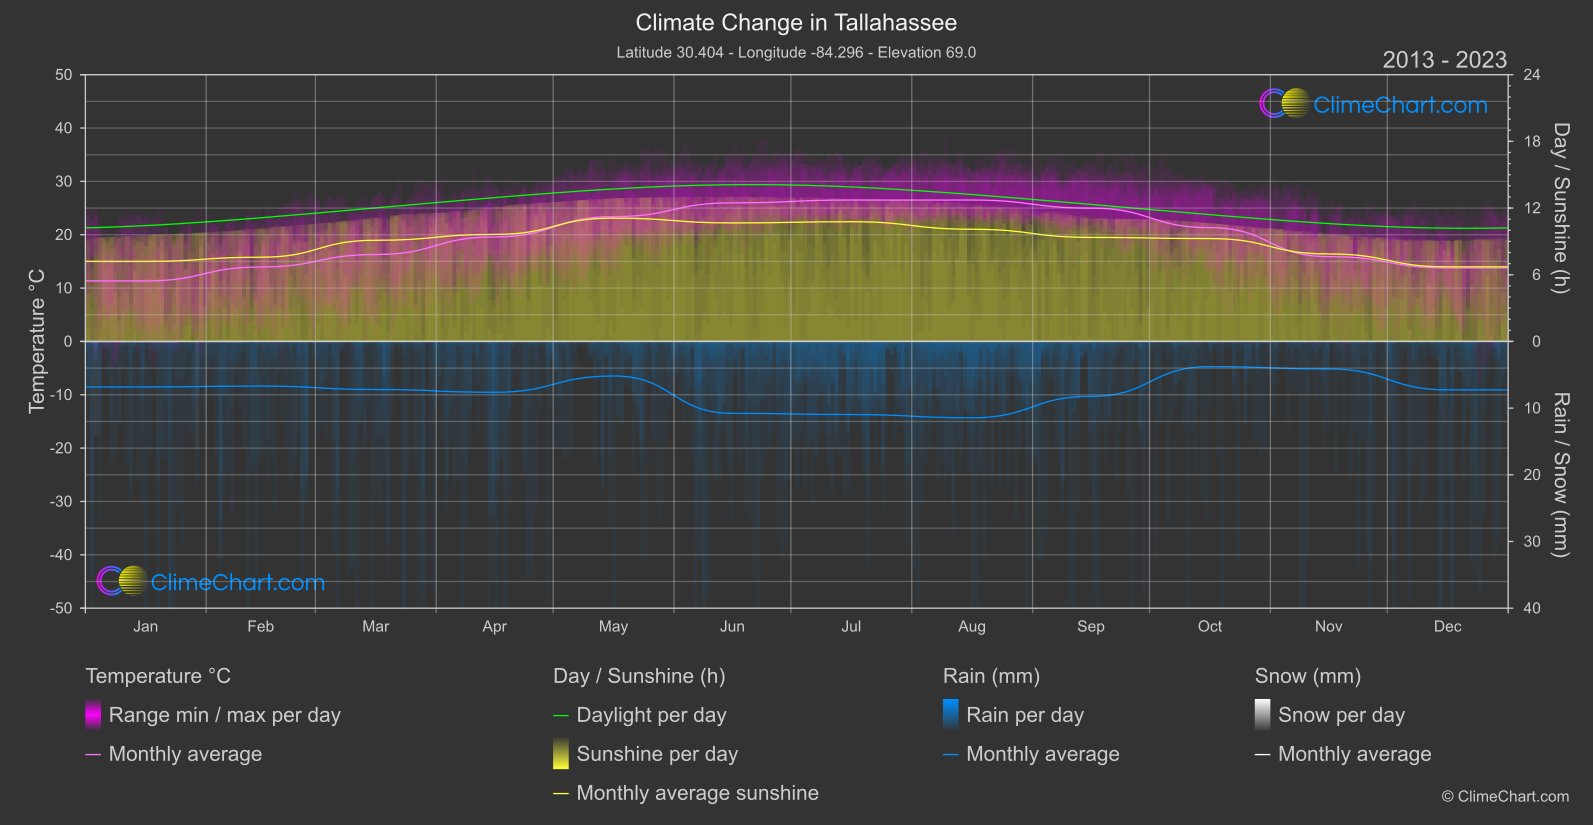
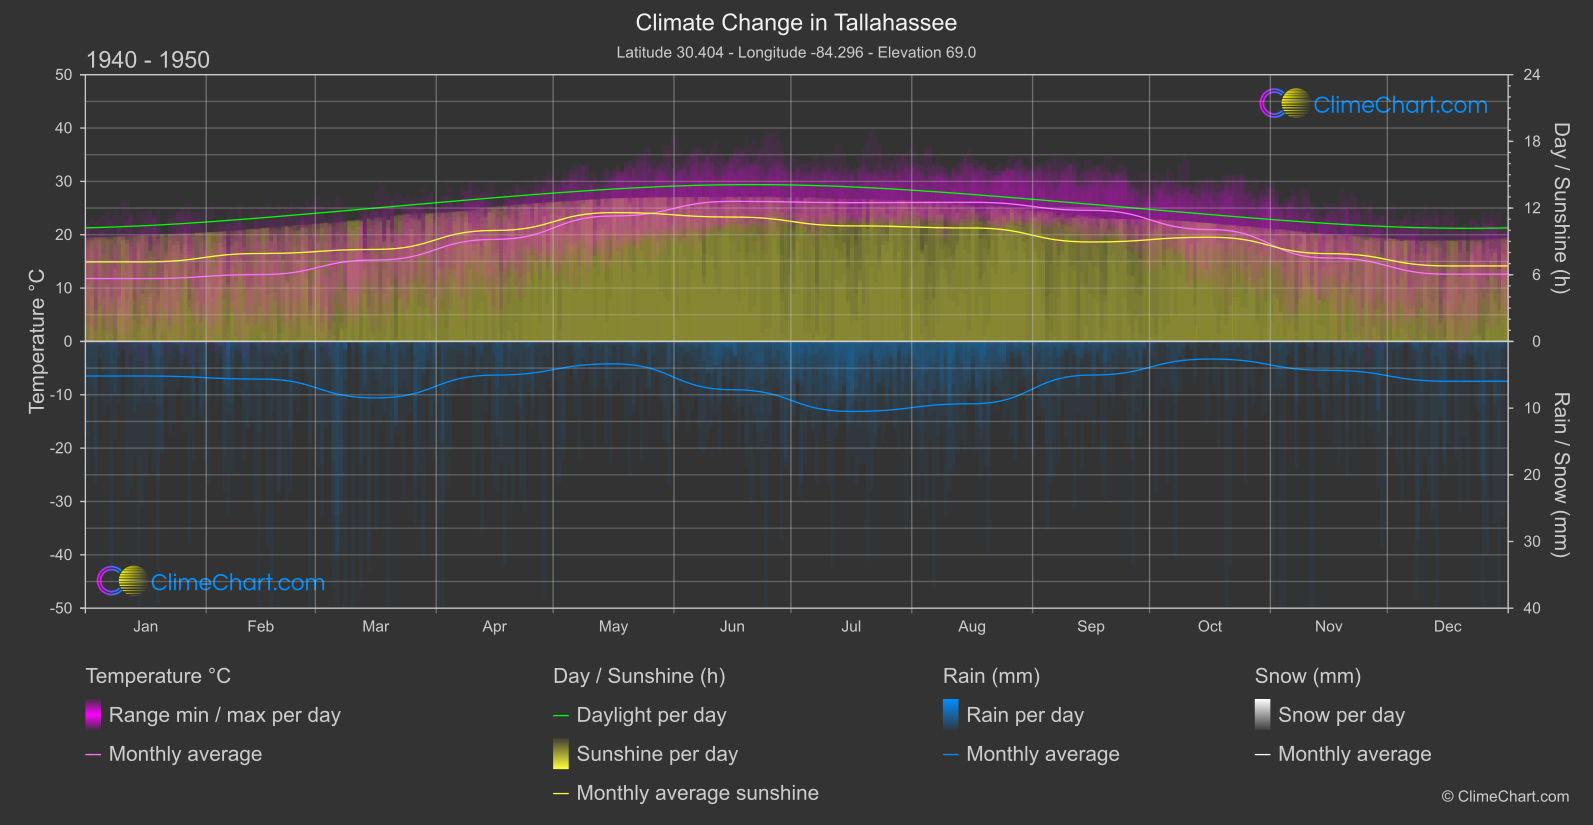
Tallahassee, USA, experiences notable changes in climate parameters such as temperature, rainfall, and sunshine duration. Comparing data from the 1940s-1950s to 2013-2024 reveals interesting insights. For instance, February shows a significant increase in temperature, while September sees a substantial rise in rainfall. The sunshine duration also exhibits variations across different months, with notable changes in March and June. Understanding these patterns is crucial for adapting to the evolving climate in Tallahassee.
Climate Change Data Overview for Tallahassee, USA
Explore the comprehensive climate change data for Tallahassee, USA. This detailed table provides valuable insights into temperature variations, precipitation levels, and seasonal changes influenced by climate change, helping you understand the unique weather patterns of this region.
Temperature °C
| Month | ⌀ 1940 - 1950 | ⌀ 2013 - 2023 | +/- |
|---|---|---|---|
| Jan | 11.78 | 11.34 | -0.44 |
| Feb | 12.53 | 13.95 | 1.42 |
| Mar | 15.26 | 16.29 | 1.04 |
| Apr | 19.13 | 19.58 | 0.45 |
| May | 23.52 | 23.40 | -0.12 |
| Jun | 26.26 | 25.98 | -0.28 |
| Jul | 26.01 | 26.50 | 0.49 |
| Aug | 26.07 | 26.50 | 0.43 |
| Sep | 24.58 | 24.99 | 0.41 |
| Oct | 20.97 | 21.33 | 0.35 |
| Nov | 15.65 | 15.89 | 0.25 |
| Dec | 12.61 | 13.77 | 1.16 |
| ⌀ Month | 19.53 | 19.96 | 0.43 |
Sunshine (h)
| Month | ⌀ 1940 - 1950 | ⌀ 2013 - 2023 | +/- |
|---|---|---|---|
| Jan | 7.16 | 7.20 | 0.04 |
| Feb | 7.91 | 7.58 | -0.33 |
| Mar | 8.28 | 9.10 | 0.82 |
| Apr | 9.98 | 9.63 | -0.35 |
| May | 11.59 | 11.09 | -0.50 |
| Jun | 11.19 | 10.66 | -0.53 |
| Jul | 10.40 | 10.77 | 0.37 |
| Aug | 10.21 | 10.09 | -0.11 |
| Sep | 8.95 | 9.36 | 0.41 |
| Oct | 9.37 | 9.25 | -0.12 |
| Nov | 7.90 | 7.87 | -0.03 |
| Dec | 6.79 | 6.71 | -0.08 |
| ⌀ Month | 9.14 | 9.11 | -0.03 |
Rain (mm)
| Month | ⌀ 1940 - 1950 | ⌀ 2013 - 2023 | +/- |
|---|---|---|---|
| Jan | 2.59 | 3.41 | 0.82 |
| Feb | 2.82 | 3.35 | 0.53 |
| Mar | 4.23 | 3.60 | -0.63 |
| Apr | 2.52 | 3.81 | 1.29 |
| May | 1.68 | 2.59 | 0.91 |
| Jun | 3.62 | 5.39 | 1.77 |
| Jul | 5.25 | 5.48 | 0.23 |
| Aug | 4.67 | 5.72 | 1.05 |
| Sep | 2.52 | 4.12 | 1.59 |
| Oct | 1.32 | 1.89 | 0.57 |
| Nov | 2.17 | 2.06 | -0.11 |
| Dec | 2.99 | 3.63 | 0.65 |
| ⌀ Month | 3.03 | 3.76 | 0.72 |
Snow (mm)
| Month | ⌀ 1940 - 1950 | ⌀ 2013 - 2023 | +/- |
|---|---|---|---|
| Jan | 0.00 | 0.01 | 0.01 |
| Feb | 0.00 | 0.00 | 0.00 |
| Mar | 0.00 | 0.00 | 0.00 |
| Apr | 0.00 | 0.00 | 0.00 |
| May | 0.00 | 0.00 | 0.00 |
| Jun | 0.00 | 0.00 | 0.00 |
| Jul | 0.00 | 0.00 | 0.00 |
| Aug | 0.00 | 0.00 | 0.00 |
| Sep | 0.00 | 0.00 | 0.00 |
| Oct | 0.00 | 0.00 | 0.00 |
| Nov | 0.00 | 0.00 | 0.00 |
| Dec | 0.00 | 0.00 | 0.00 |
| ⌀ Month | 0.00 | 0.00 | 0.00 |