Climate Change Chart of Sucre, Bolivia
Comprehensive Climate Change Chart of Sucre, Bolivia: Monthly Averages and Impact Trends
Explore the changing climate in Sucre, Bolivia with insightful data comparisons from 1940 - 1950 to 2013 - 2024.
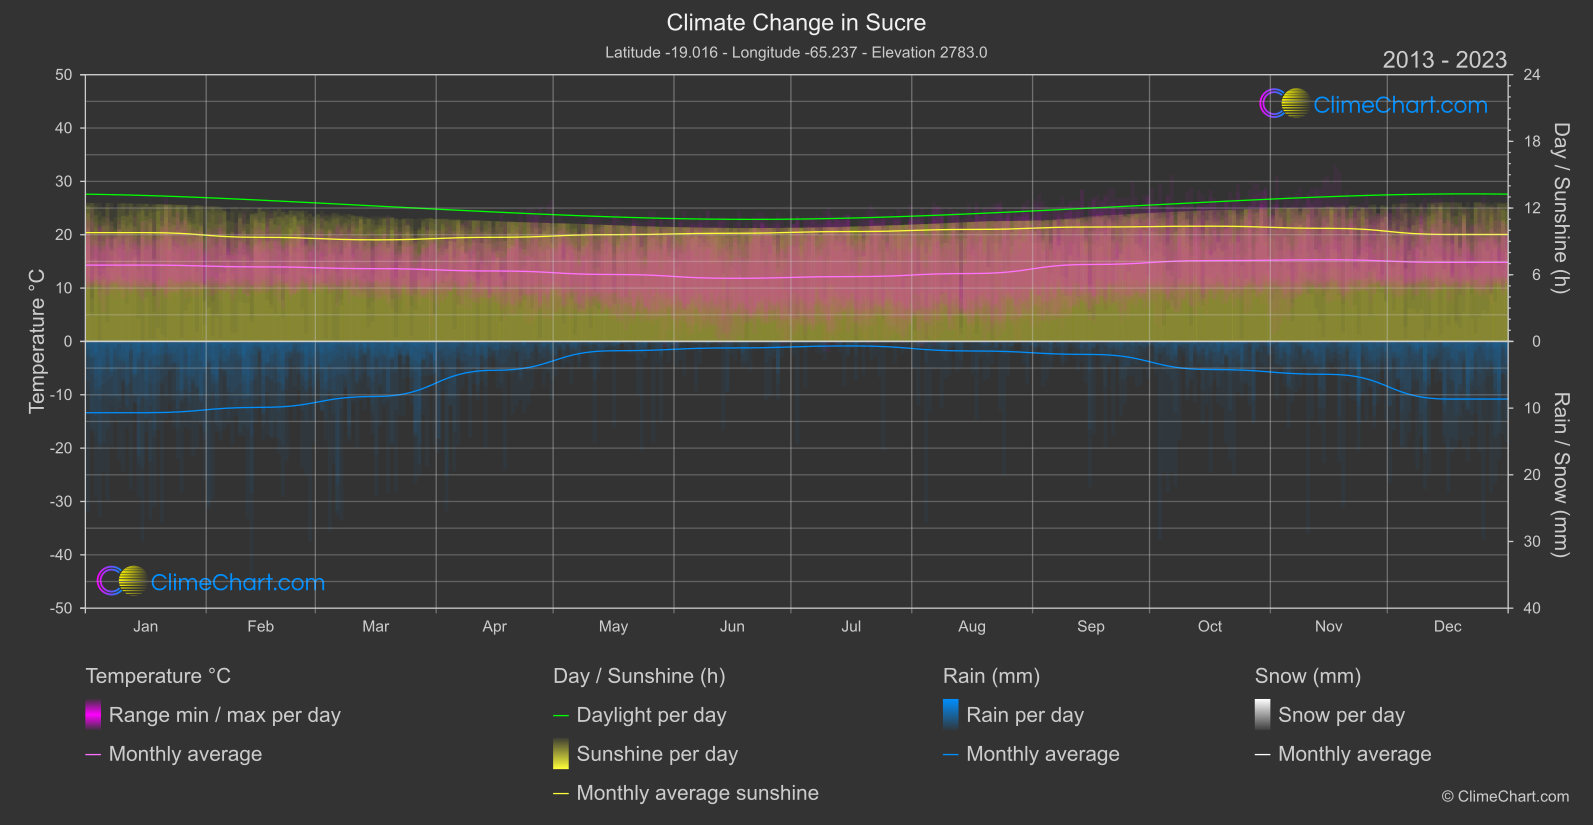
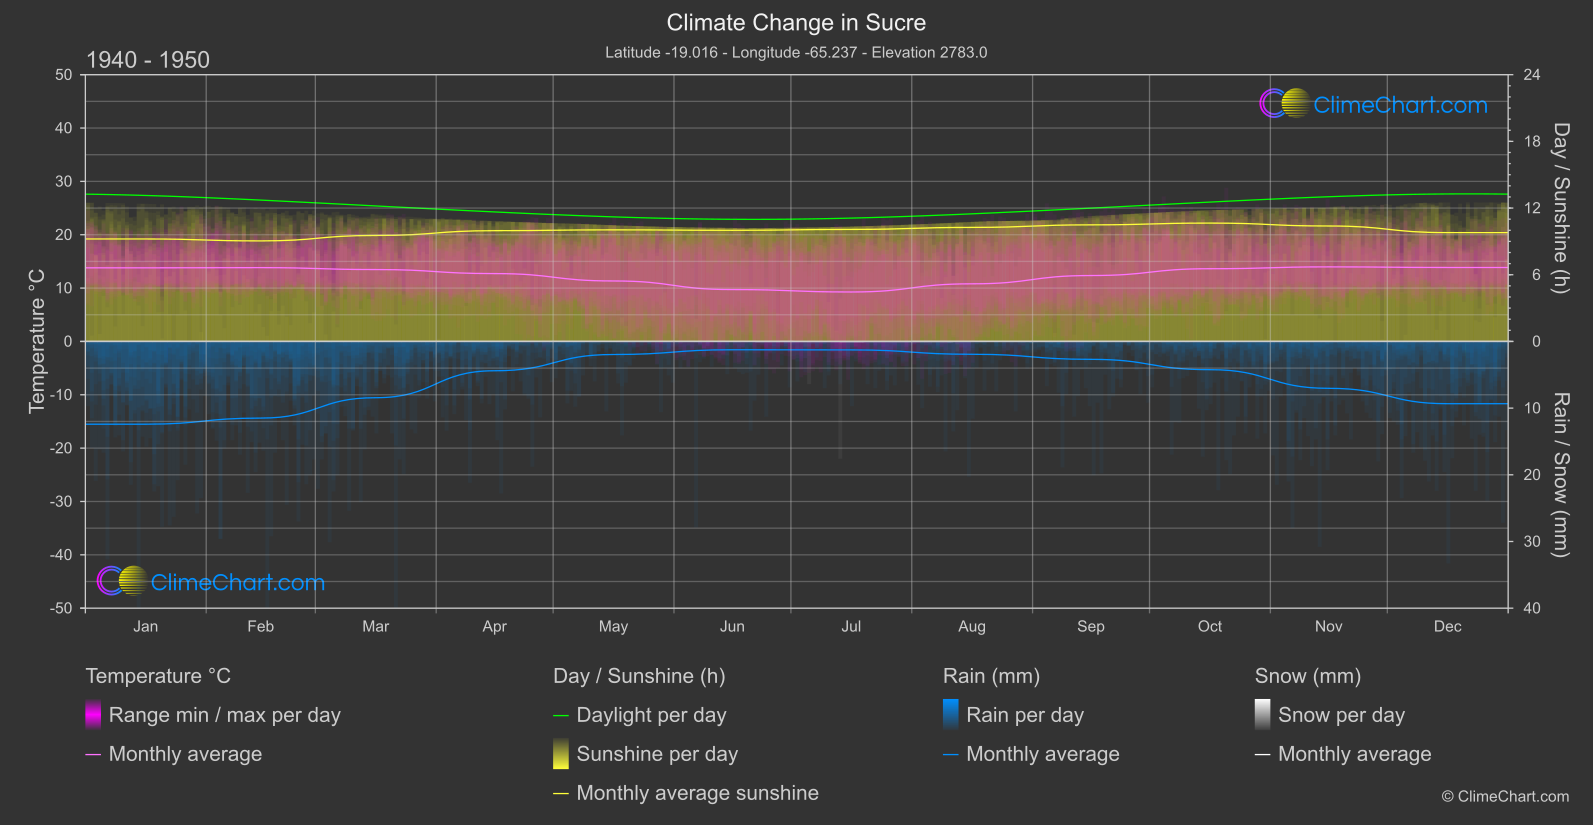
Sucre, Bolivia experiences noticeable changes in temperature, rainfall, snowfall, and sunshine duration. The data from the past compared to recent years reflect a trend of increasing temperatures and changes in precipitation patterns. Notably, June and July show significant temperature rises, while November experiences a notable decrease in rainfall. The comparison of sunshine hours indicates variations throughout the year, with some months showing a decrease in sunshine duration.
Climate Change Data Overview for Sucre, Bolivia
Explore the comprehensive climate change data for Sucre, Bolivia. This detailed table provides valuable insights into temperature variations, precipitation levels, and seasonal changes influenced by climate change, helping you understand the unique weather patterns of this region.
Temperature °C
| Month | ⌀ 1940 - 1950 | ⌀ 2013 - 2023 | +/- |
|---|---|---|---|
| Jan | 13.79 | 14.30 | 0.51 |
| Feb | 13.83 | 13.98 | 0.14 |
| Mar | 13.48 | 13.64 | 0.16 |
| Apr | 12.72 | 13.20 | 0.49 |
| May | 11.33 | 12.55 | 1.21 |
| Jun | 9.72 | 11.84 | 2.11 |
| Jul | 9.27 | 12.15 | 2.89 |
| Aug | 10.80 | 12.73 | 1.93 |
| Sep | 12.35 | 14.43 | 2.08 |
| Oct | 13.63 | 15.15 | 1.52 |
| Nov | 13.98 | 15.30 | 1.32 |
| Dec | 13.86 | 14.82 | 0.96 |
| ⌀ Month | 12.40 | 13.67 | 1.28 |
Sunshine (h)
| Month | ⌀ 1940 - 1950 | ⌀ 2013 - 2023 | +/- |
|---|---|---|---|
| Jan | 9.22 | 9.79 | 0.57 |
| Feb | 9.04 | 9.37 | 0.32 |
| Mar | 9.53 | 9.14 | -0.39 |
| Apr | 9.96 | 9.37 | -0.60 |
| May | 10.04 | 9.61 | -0.43 |
| Jun | 10.00 | 9.73 | -0.26 |
| Jul | 10.08 | 9.89 | -0.19 |
| Aug | 10.26 | 10.08 | -0.18 |
| Sep | 10.49 | 10.29 | -0.19 |
| Oct | 10.65 | 10.37 | -0.28 |
| Nov | 10.39 | 10.18 | -0.21 |
| Dec | 9.79 | 9.62 | -0.17 |
| ⌀ Month | 9.95 | 9.79 | -0.17 |
Rain (mm)
| Month | ⌀ 1940 - 1950 | ⌀ 2013 - 2023 | +/- |
|---|---|---|---|
| Jan | 6.21 | 5.34 | -0.86 |
| Feb | 5.75 | 4.94 | -0.80 |
| Mar | 4.22 | 4.13 | -0.09 |
| Apr | 2.20 | 2.16 | -0.04 |
| May | 0.98 | 0.70 | -0.28 |
| Jun | 0.62 | 0.49 | -0.14 |
| Jul | 0.64 | 0.34 | -0.30 |
| Aug | 0.96 | 0.72 | -0.25 |
| Sep | 1.34 | 0.98 | -0.37 |
| Oct | 2.12 | 2.10 | -0.01 |
| Nov | 3.52 | 2.47 | -1.05 |
| Dec | 4.67 | 4.32 | -0.35 |
| ⌀ Month | 2.77 | 2.39 | -0.38 |
Snow (mm)
| Month | ⌀ 1940 - 1950 | ⌀ 2013 - 2023 | +/- |
|---|---|---|---|
| Jan | 0.00 | 0.00 | 0.00 |
| Feb | 0.00 | 0.00 | 0.00 |
| Mar | 0.00 | 0.00 | 0.00 |
| Apr | 0.00 | 0.00 | 0.00 |
| May | 0.00 | 0.00 | 0.00 |
| Jun | 0.00 | 0.00 | 0.00 |
| Jul | 0.01 | 0.00 | -0.01 |
| Aug | 0.00 | 0.00 | 0.00 |
| Sep | 0.00 | 0.00 | 0.00 |
| Oct | 0.00 | 0.00 | 0.00 |
| Nov | 0.00 | 0.00 | 0.00 |
| Dec | 0.00 | 0.00 | 0.00 |
| ⌀ Month | 0.00 | 0.00 | -0.00 |