Climate Change Chart of Stevens Pass, USA
Comprehensive Climate Change Chart of Stevens Pass, USA: Monthly Averages and Impact Trends
Explore the changing climate in Stevens Pass, USA, through insightful data analysis.
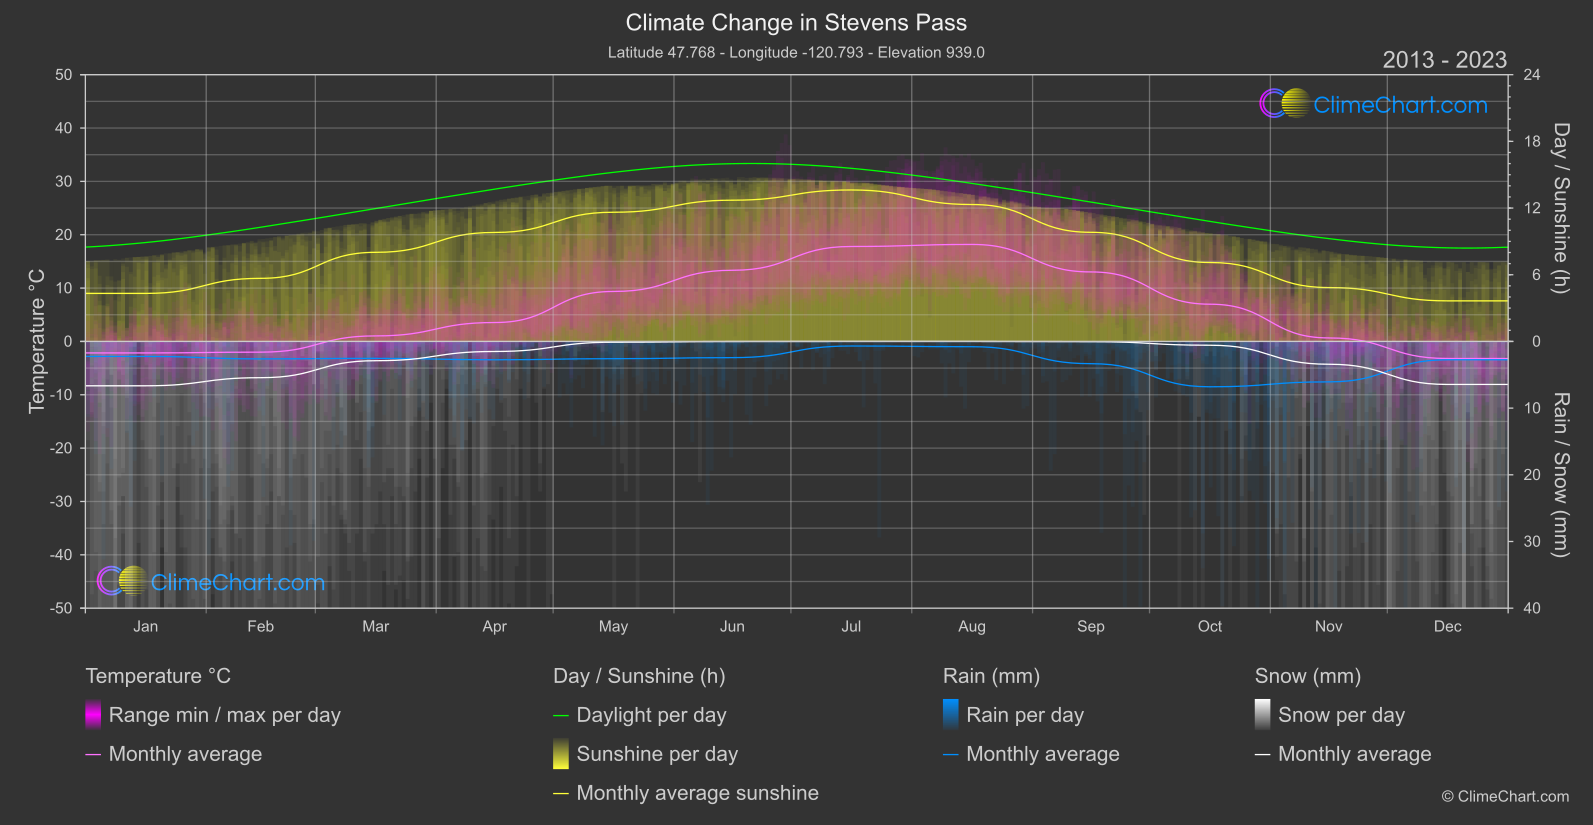
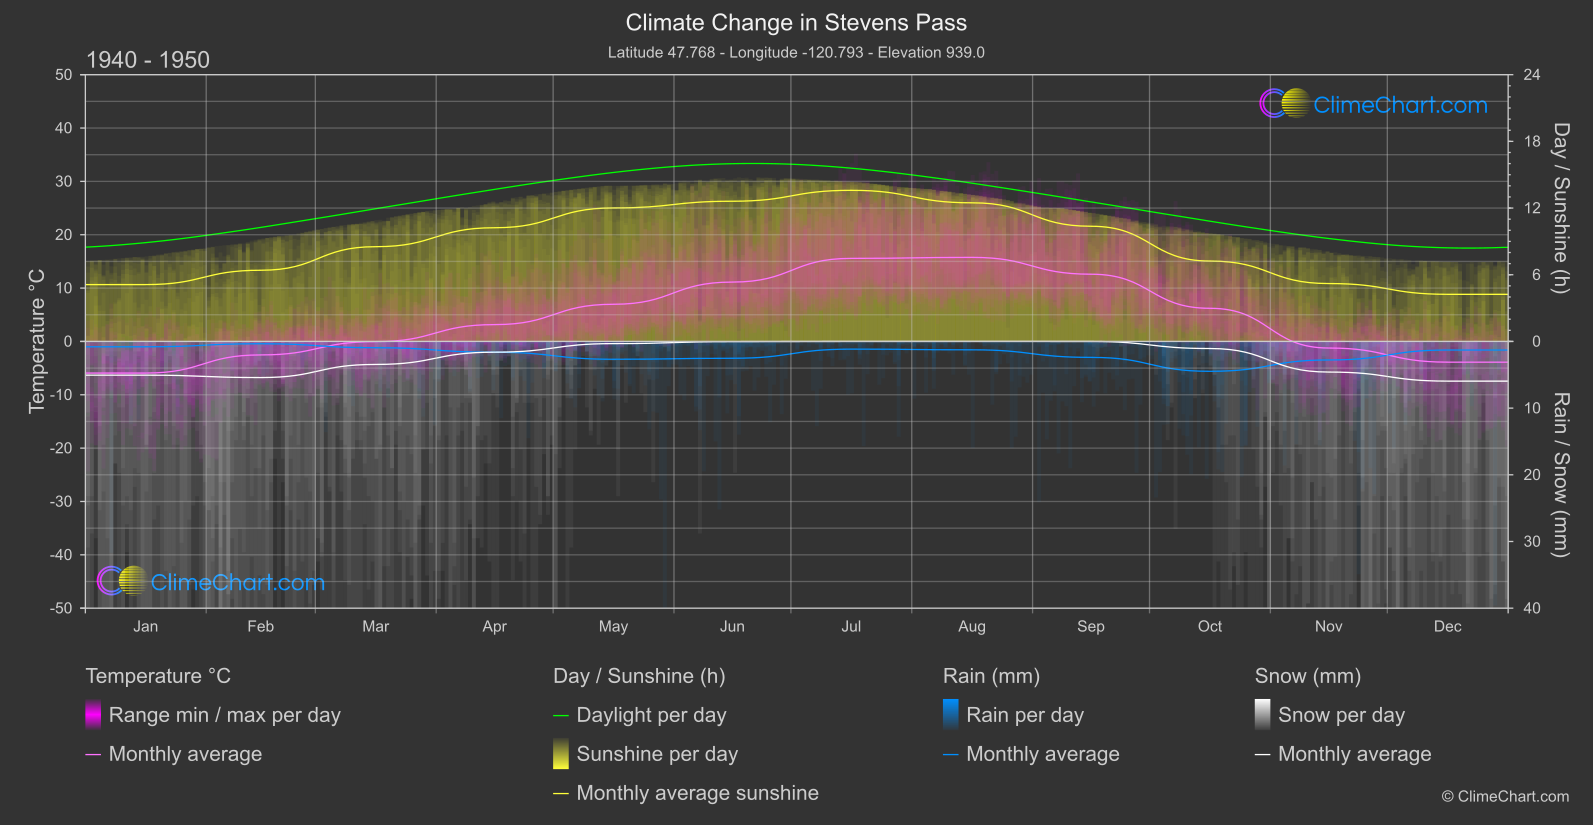
Stevens Pass, located in the United States, has seen significant changes in temperature, rainfall, snowfall, and sunshine duration over the years. Analyzing the data from 1940 to 1950 compared to 2013 to 2024 reveals interesting patterns. For example, the month with the highest temperature change is June, with a difference of 2.21°C. In terms of rainfall, November shows the most significant increase of 1.64mm. Snowfall has decreased in November by 0.59mm, and sunshine duration has decreased the most in December by 0.59 hours.
Climate Change Data Overview for Stevens Pass, USA
Explore the comprehensive climate change data for Stevens Pass, USA. This detailed table provides valuable insights into temperature variations, precipitation levels, and seasonal changes influenced by climate change, helping you understand the unique weather patterns of this region.
Temperature °C
| Month | ⌀ 1940 - 1950 | ⌀ 2013 - 2023 | +/- |
|---|---|---|---|
| Jan | -5.93 | -2.16 | 3.77 |
| Feb | -2.53 | -2.01 | 0.52 |
| Mar | -0.04 | 1.04 | 1.07 |
| Apr | 3.15 | 3.54 | 0.39 |
| May | 6.97 | 9.37 | 2.40 |
| Jun | 11.13 | 13.34 | 2.21 |
| Jul | 15.57 | 17.80 | 2.23 |
| Aug | 15.76 | 18.18 | 2.42 |
| Sep | 12.60 | 13.03 | 0.43 |
| Oct | 6.21 | 6.98 | 0.77 |
| Nov | -1.24 | 0.65 | 1.89 |
| Dec | -3.88 | -3.20 | 0.69 |
| ⌀ Month | 4.81 | 6.38 | 1.57 |
Sunshine (h)
| Month | ⌀ 1940 - 1950 | ⌀ 2013 - 2023 | +/- |
|---|---|---|---|
| Jan | 5.11 | 4.32 | -0.79 |
| Feb | 6.40 | 5.68 | -0.73 |
| Mar | 8.52 | 8.02 | -0.51 |
| Apr | 10.23 | 9.81 | -0.42 |
| May | 12.01 | 11.62 | -0.39 |
| Jun | 12.61 | 12.71 | 0.09 |
| Jul | 13.60 | 13.63 | 0.03 |
| Aug | 12.47 | 12.32 | -0.15 |
| Sep | 10.36 | 9.82 | -0.54 |
| Oct | 7.23 | 7.10 | -0.13 |
| Nov | 5.21 | 4.85 | -0.36 |
| Dec | 4.24 | 3.65 | -0.59 |
| ⌀ Month | 9.00 | 8.63 | -0.37 |
Rain (mm)
| Month | ⌀ 1940 - 1950 | ⌀ 2013 - 2023 | +/- |
|---|---|---|---|
| Jan | 0.40 | 1.13 | 0.72 |
| Feb | 0.17 | 1.31 | 1.13 |
| Mar | 0.47 | 1.27 | 0.80 |
| Apr | 0.81 | 1.37 | 0.56 |
| May | 1.34 | 1.29 | -0.04 |
| Jun | 1.26 | 1.21 | -0.05 |
| Jul | 0.58 | 0.34 | -0.23 |
| Aug | 0.63 | 0.40 | -0.23 |
| Sep | 1.20 | 1.67 | 0.47 |
| Oct | 2.24 | 3.40 | 1.16 |
| Nov | 1.39 | 3.03 | 1.64 |
| Dec | 0.64 | 1.38 | 0.73 |
| ⌀ Month | 0.93 | 1.48 | 0.56 |
Snow (mm)
| Month | ⌀ 1940 - 1950 | ⌀ 2013 - 2023 | +/- |
|---|---|---|---|
| Jan | 2.53 | 3.33 | 0.80 |
| Feb | 2.71 | 2.72 | 0.01 |
| Mar | 1.72 | 1.45 | -0.28 |
| Apr | 0.80 | 0.75 | -0.05 |
| May | 0.16 | 0.06 | -0.10 |
| Jun | 0.01 | 0.01 | -0.01 |
| Jul | 0.00 | 0.00 | 0.00 |
| Aug | 0.00 | 0.00 | 0.00 |
| Sep | 0.00 | 0.02 | 0.02 |
| Oct | 0.53 | 0.28 | -0.25 |
| Nov | 2.30 | 1.71 | -0.59 |
| Dec | 2.98 | 3.22 | 0.25 |
| ⌀ Month | 1.15 | 1.13 | -0.02 |