Climate Change Chart of Stanley, Falkland Islands (Malvinas)
Comprehensive Climate Change Chart of Stanley, Falkland Islands (Malvinas): Monthly Averages and Impact Trends
Exploring the changing climate in Stanley, Falkland Islands (Malvinas)
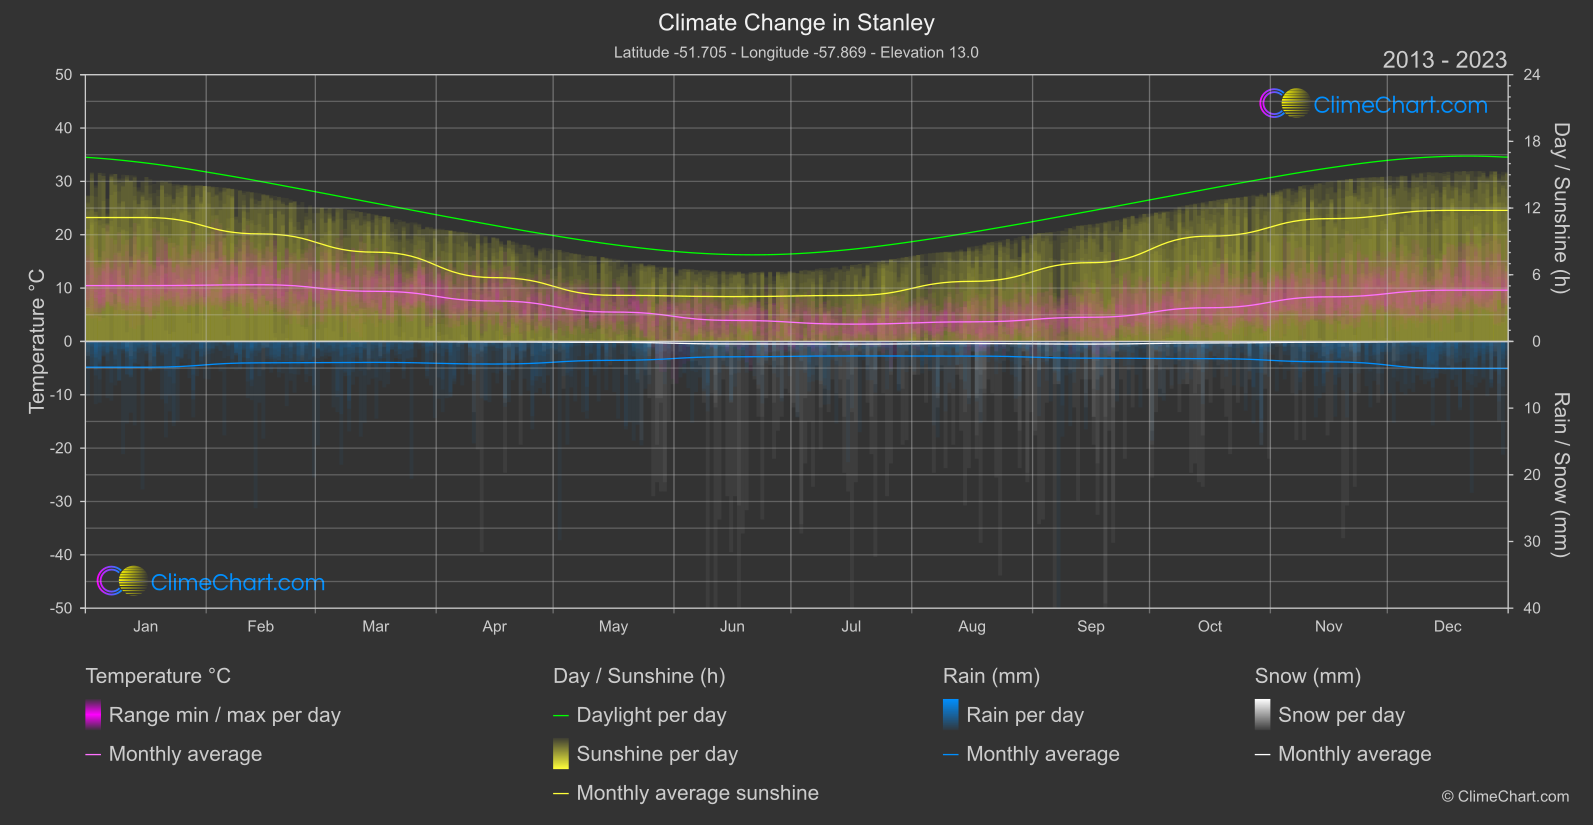
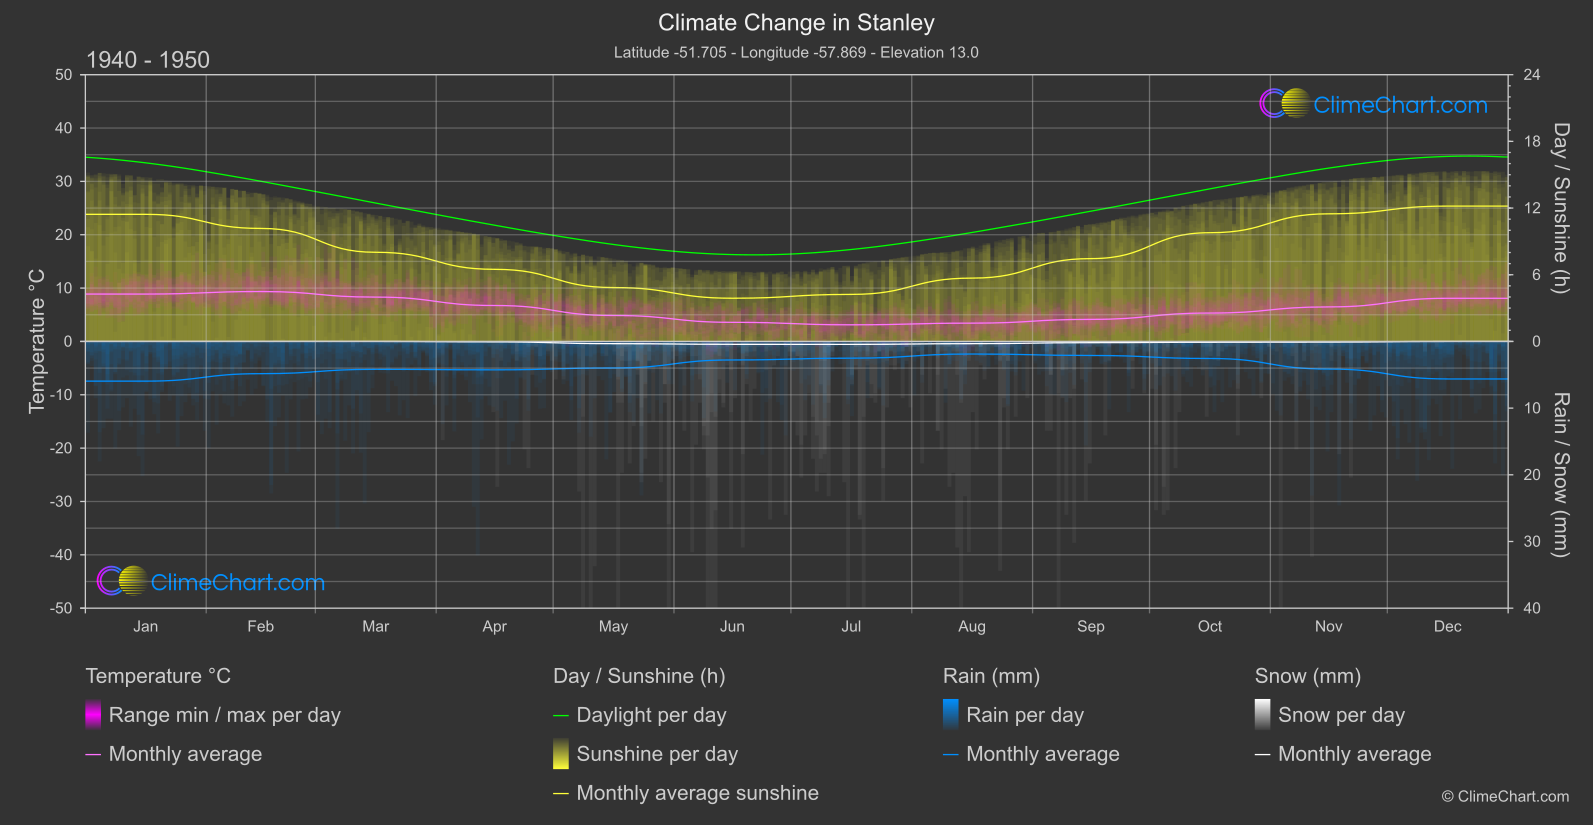
Stanley, located in the Falkland Islands (Malvinas), has been experiencing notable changes in climate over the years. The data shows shifts in temperature, rainfall, snowfall, and sunshine duration from the mid-20th century to the early 21st century. Notably, the months of November and December have shown significant increases in temperature, while rainfall has decreased in several months. Snowfall has generally decreased, and sunshine duration has also seen variations.
Climate Change Data Overview for Stanley, Falkland Islands (Malvinas)
Explore the comprehensive climate change data for Stanley, Falkland Islands (Malvinas). This detailed table provides valuable insights into temperature variations, precipitation levels, and seasonal changes influenced by climate change, helping you understand the unique weather patterns of this region.
Temperature °C
| Month | ⌀ 1940 - 1950 | ⌀ 2013 - 2023 | +/- |
|---|---|---|---|
| Jan | 8.88 | 10.47 | 1.59 |
| Feb | 9.35 | 10.62 | 1.27 |
| Mar | 8.31 | 9.39 | 1.08 |
| Apr | 6.74 | 7.59 | 0.85 |
| May | 4.86 | 5.51 | 0.65 |
| Jun | 3.58 | 3.94 | 0.36 |
| Jul | 3.12 | 3.24 | 0.13 |
| Aug | 3.43 | 3.67 | 0.24 |
| Sep | 4.13 | 4.53 | 0.40 |
| Oct | 5.32 | 6.32 | 1.00 |
| Nov | 6.47 | 8.36 | 1.89 |
| Dec | 8.09 | 9.61 | 1.52 |
| ⌀ Month | 6.02 | 6.94 | 0.91 |
Sunshine (h)
| Month | ⌀ 1940 - 1950 | ⌀ 2013 - 2023 | +/- |
|---|---|---|---|
| Jan | 11.44 | 11.15 | -0.29 |
| Feb | 10.17 | 9.67 | -0.50 |
| Mar | 8.02 | 8.03 | 0.01 |
| Apr | 6.49 | 5.74 | -0.75 |
| May | 4.85 | 4.15 | -0.70 |
| Jun | 3.89 | 4.03 | 0.15 |
| Jul | 4.23 | 4.14 | -0.09 |
| Aug | 5.70 | 5.41 | -0.29 |
| Sep | 7.45 | 7.09 | -0.36 |
| Oct | 9.78 | 9.48 | -0.31 |
| Nov | 11.48 | 11.05 | -0.43 |
| Dec | 12.18 | 11.79 | -0.38 |
| ⌀ Month | 7.97 | 7.64 | -0.33 |
Rain (mm)
| Month | ⌀ 1940 - 1950 | ⌀ 2013 - 2023 | +/- |
|---|---|---|---|
| Jan | 2.98 | 1.93 | -1.04 |
| Feb | 2.42 | 1.60 | -0.81 |
| Mar | 2.09 | 1.57 | -0.52 |
| Apr | 2.13 | 1.69 | -0.43 |
| May | 1.99 | 1.42 | -0.57 |
| Jun | 1.39 | 1.15 | -0.24 |
| Jul | 1.25 | 1.09 | -0.17 |
| Aug | 0.94 | 1.10 | 0.16 |
| Sep | 1.05 | 1.26 | 0.20 |
| Oct | 1.28 | 1.29 | 0.01 |
| Nov | 2.07 | 1.53 | -0.54 |
| Dec | 2.81 | 2.03 | -0.79 |
| ⌀ Month | 1.87 | 1.47 | -0.39 |
Snow (mm)
| Month | ⌀ 1940 - 1950 | ⌀ 2013 - 2023 | +/- |
|---|---|---|---|
| Jan | 0.00 | 0.00 | 0.00 |
| Feb | 0.00 | 0.00 | 0.00 |
| Mar | 0.00 | 0.00 | 0.00 |
| Apr | 0.03 | 0.04 | 0.01 |
| May | 0.17 | 0.07 | -0.10 |
| Jun | 0.22 | 0.19 | -0.03 |
| Jul | 0.22 | 0.20 | -0.02 |
| Aug | 0.17 | 0.16 | -0.01 |
| Sep | 0.09 | 0.20 | 0.11 |
| Oct | 0.06 | 0.11 | 0.05 |
| Nov | 0.05 | 0.06 | 0.01 |
| Dec | 0.00 | 0.01 | 0.01 |
| ⌀ Month | 0.08 | 0.09 | 0.00 |