Climate Change Chart of St. Pierre, Saint Pierre and Miquelon
Comprehensive Climate Change Chart of St. Pierre, Saint Pierre and Miquelon: Monthly Averages and Impact Trends
Exploring the changing climate in St. Pierre, Saint Pierre and Miquelon reveals significant shifts in temperature, rainfall, snowfall, and sunshine duration over the years.
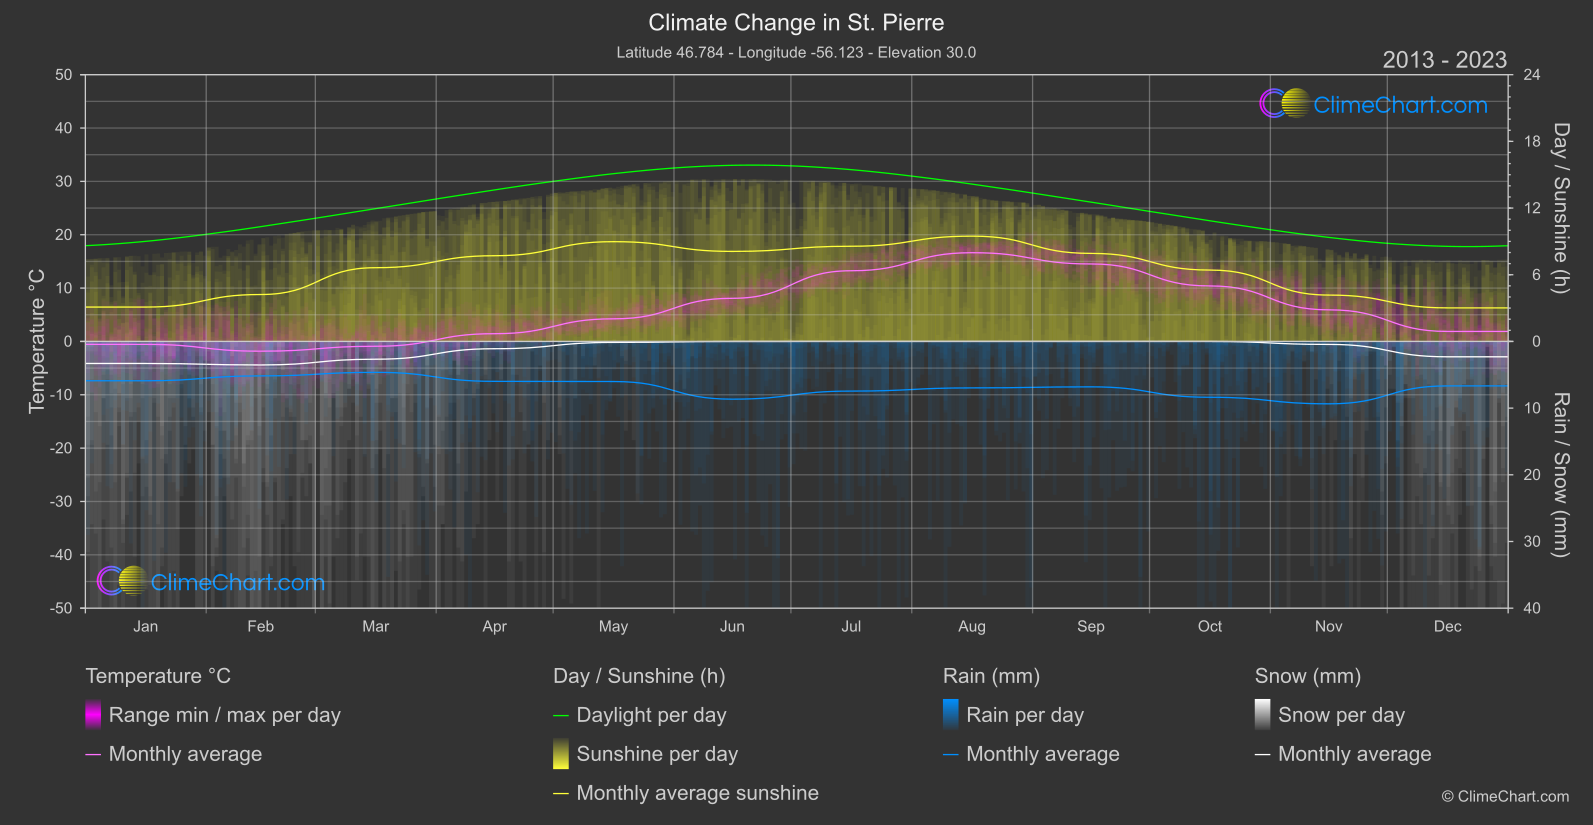
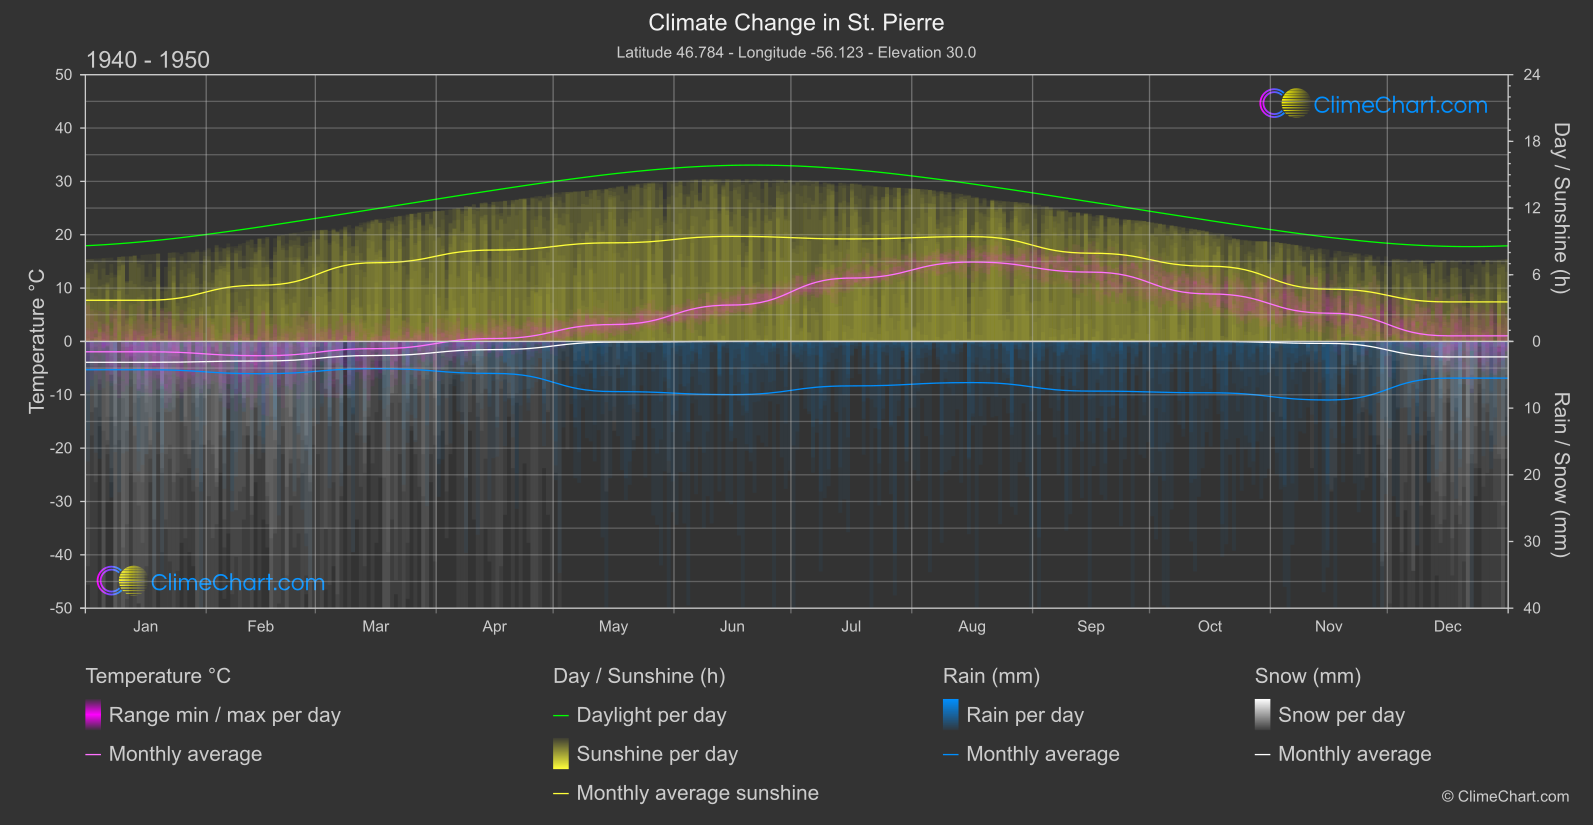
St. Pierre, Saint Pierre and Miquelon experience a notable increase in temperatures from January to August, with July having the highest temperature change. Rainfall patterns show varying trends across the months, with May experiencing a decrease in rainfall. Snowfall is minimal in the region, with slight fluctuations in November and December. Sunshine duration fluctuates throughout the year, with June exhibiting the most significant decrease in sunlight hours.
Climate Change Data Overview for St. Pierre, Saint Pierre and Miquelon
Explore the comprehensive climate change data for St. Pierre, Saint Pierre and Miquelon. This detailed table provides valuable insights into temperature variations, precipitation levels, and seasonal changes influenced by climate change, helping you understand the unique weather patterns of this region.
Temperature °C
| Month | ⌀ 1940 - 1950 | ⌀ 2013 - 2023 | +/- |
|---|---|---|---|
| Jan | -1.94 | -0.55 | 1.39 |
| Feb | -2.68 | -1.83 | 0.85 |
| Mar | -1.35 | -0.90 | 0.45 |
| Apr | 0.54 | 1.45 | 0.91 |
| May | 3.17 | 4.24 | 1.07 |
| Jun | 6.83 | 8.08 | 1.26 |
| Jul | 11.88 | 13.25 | 1.37 |
| Aug | 14.89 | 16.63 | 1.74 |
| Sep | 12.99 | 14.52 | 1.53 |
| Oct | 8.90 | 10.40 | 1.50 |
| Nov | 5.29 | 5.92 | 0.63 |
| Dec | 1.05 | 1.87 | 0.82 |
| ⌀ Month | 4.96 | 6.09 | 1.13 |
Sunshine (h)
| Month | ⌀ 1940 - 1950 | ⌀ 2013 - 2023 | +/- |
|---|---|---|---|
| Jan | 3.70 | 3.09 | -0.61 |
| Feb | 5.06 | 4.22 | -0.84 |
| Mar | 7.08 | 6.63 | -0.45 |
| Apr | 8.22 | 7.71 | -0.51 |
| May | 8.87 | 8.98 | 0.10 |
| Jun | 9.45 | 8.10 | -1.35 |
| Jul | 9.22 | 8.56 | -0.66 |
| Aug | 9.43 | 9.47 | 0.04 |
| Sep | 7.94 | 7.92 | -0.02 |
| Oct | 6.77 | 6.42 | -0.34 |
| Nov | 4.71 | 4.17 | -0.54 |
| Dec | 3.56 | 3.02 | -0.54 |
| ⌀ Month | 7.00 | 6.53 | -0.48 |
Rain (mm)
| Month | ⌀ 1940 - 1950 | ⌀ 2013 - 2023 | +/- |
|---|---|---|---|
| Jan | 2.12 | 2.95 | 0.83 |
| Feb | 2.42 | 2.58 | 0.16 |
| Mar | 2.04 | 2.32 | 0.28 |
| Apr | 2.40 | 2.99 | 0.59 |
| May | 3.76 | 3.01 | -0.75 |
| Jun | 3.99 | 4.33 | 0.34 |
| Jul | 3.33 | 3.72 | 0.39 |
| Aug | 3.09 | 3.48 | 0.40 |
| Sep | 3.72 | 3.41 | -0.32 |
| Oct | 3.85 | 4.19 | 0.33 |
| Nov | 4.39 | 4.68 | 0.29 |
| Dec | 2.75 | 3.33 | 0.58 |
| ⌀ Month | 3.16 | 3.42 | 0.26 |
Snow (mm)
| Month | ⌀ 1940 - 1950 | ⌀ 2013 - 2023 | +/- |
|---|---|---|---|
| Jan | 1.57 | 1.65 | 0.09 |
| Feb | 1.47 | 1.76 | 0.30 |
| Mar | 1.05 | 1.33 | 0.28 |
| Apr | 0.61 | 0.55 | -0.07 |
| May | 0.05 | 0.07 | 0.02 |
| Jun | 0.00 | 0.00 | 0.00 |
| Jul | 0.00 | 0.00 | 0.00 |
| Aug | 0.00 | 0.00 | 0.00 |
| Sep | 0.00 | 0.00 | 0.00 |
| Oct | 0.00 | 0.00 | 0.00 |
| Nov | 0.15 | 0.22 | 0.07 |
| Dec | 1.16 | 1.15 | -0.01 |
| ⌀ Month | 0.50 | 0.56 | 0.06 |