Climate Change Chart of St. Helier, Jersey
Comprehensive Climate Change Chart of St. Helier, Jersey: Monthly Averages and Impact Trends
Explore the changing climate in St. Helier, Jersey with data insights on temperature, rainfall, snowfall, and sunshine duration. Discover how the climate has evolved from 1940 to 1950 compared to 2013 to 2024.
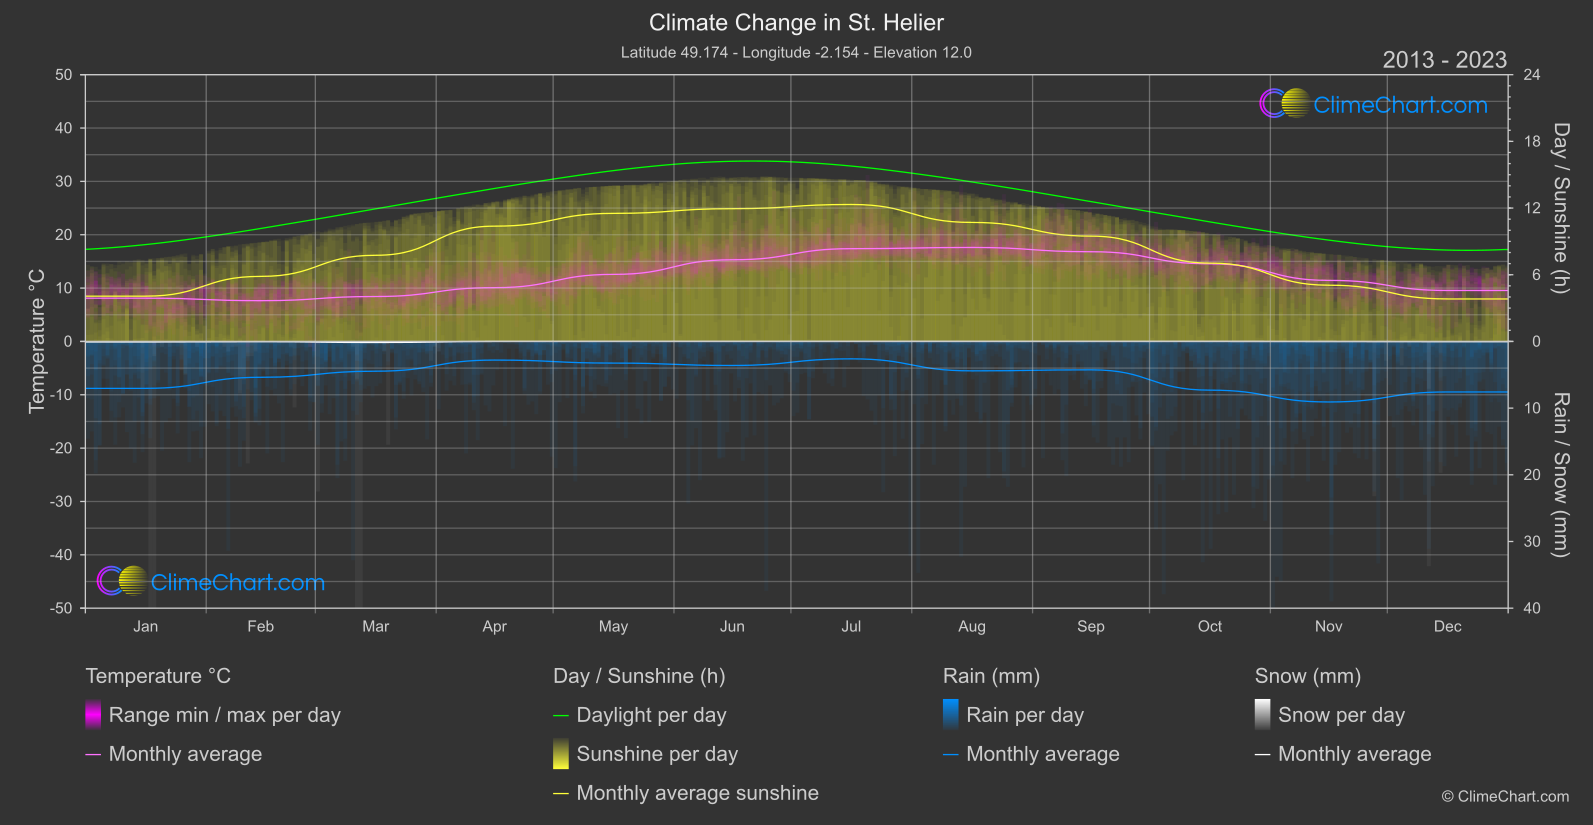
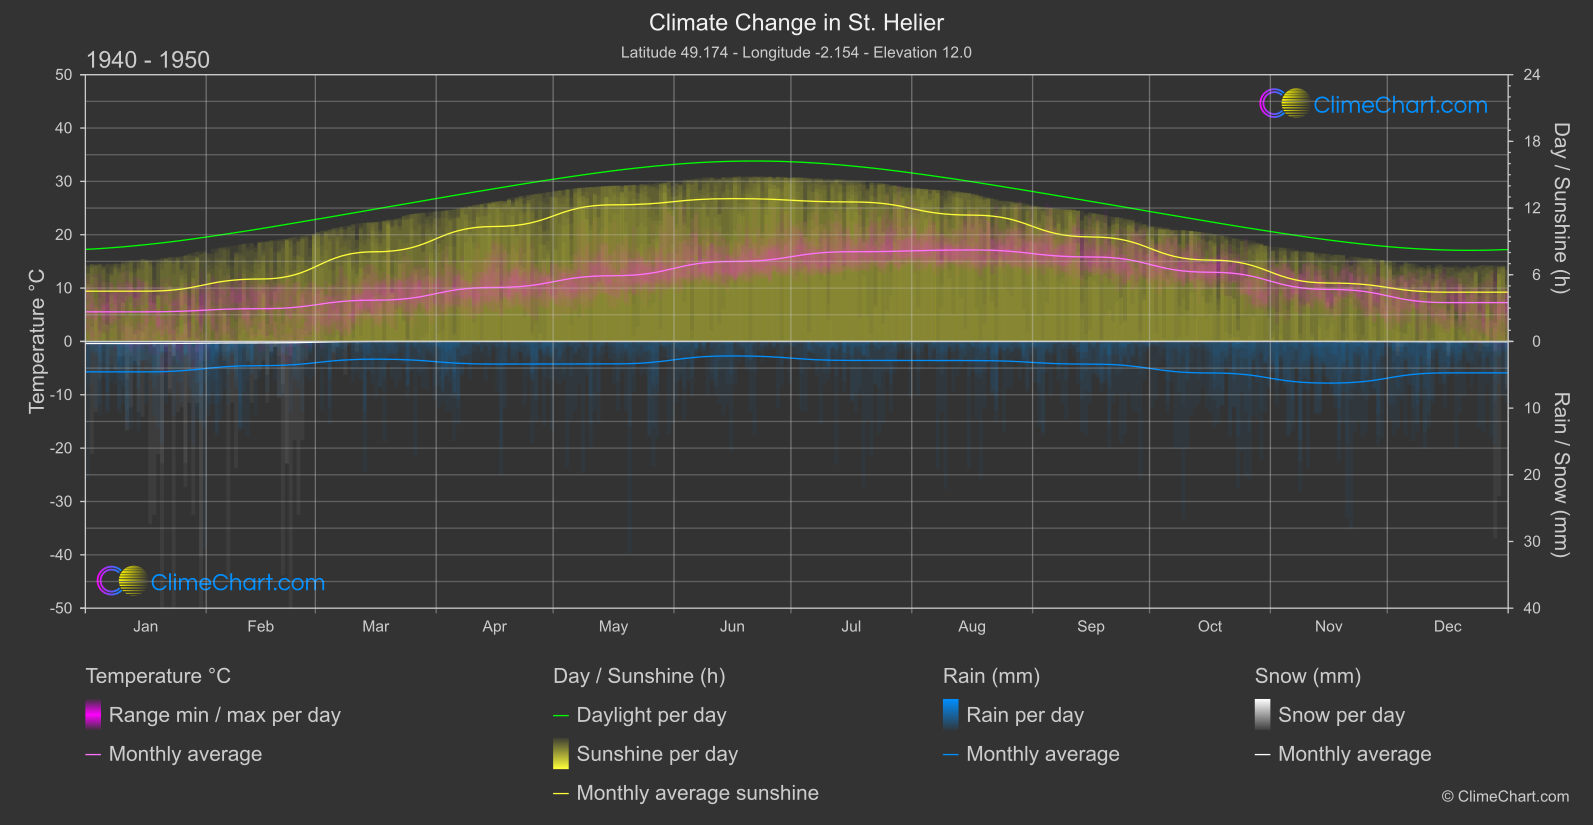
St. Helier, Jersey experiences notable changes in temperature, with January showing the highest increase of 2.56°C. The data also reveals a significant rise in rainfall, particularly in October with a 1.29mm increase. Snowfall has generally decreased over the years, with minimal fluctuations. Additionally, sunshine duration has decreased across all months, with June experiencing the largest drop of 0.90 hours.
Climate Change Data Overview for St. Helier, Jersey
Explore the comprehensive climate change data for St. Helier, Jersey. This detailed table provides valuable insights into temperature variations, precipitation levels, and seasonal changes influenced by climate change, helping you understand the unique weather patterns of this region.
Temperature °C
| Month | ⌀ 1940 - 1950 | ⌀ 2013 - 2023 | +/- |
|---|---|---|---|
| Jan | 5.55 | 8.11 | 2.56 |
| Feb | 6.14 | 7.64 | 1.50 |
| Mar | 7.74 | 8.42 | 0.68 |
| Apr | 10.12 | 10.08 | -0.04 |
| May | 12.32 | 12.57 | 0.25 |
| Jun | 14.99 | 15.31 | 0.32 |
| Jul | 16.81 | 17.39 | 0.57 |
| Aug | 17.14 | 17.62 | 0.47 |
| Sep | 15.84 | 16.81 | 0.98 |
| Oct | 12.97 | 14.55 | 1.58 |
| Nov | 9.76 | 11.44 | 1.69 |
| Dec | 7.28 | 9.55 | 2.28 |
| ⌀ Month | 11.39 | 12.46 | 1.07 |
Sunshine (h)
| Month | ⌀ 1940 - 1950 | ⌀ 2013 - 2023 | +/- |
|---|---|---|---|
| Jan | 4.52 | 4.07 | -0.45 |
| Feb | 5.62 | 5.85 | 0.23 |
| Mar | 8.07 | 7.75 | -0.32 |
| Apr | 10.34 | 10.37 | 0.03 |
| May | 12.29 | 11.52 | -0.77 |
| Jun | 12.85 | 11.94 | -0.90 |
| Jul | 12.55 | 12.32 | -0.23 |
| Aug | 11.37 | 10.71 | -0.66 |
| Sep | 9.40 | 9.47 | 0.07 |
| Oct | 7.32 | 7.05 | -0.27 |
| Nov | 5.26 | 5.06 | -0.20 |
| Dec | 4.43 | 3.82 | -0.61 |
| ⌀ Month | 8.67 | 8.33 | -0.34 |
Rain (mm)
| Month | ⌀ 1940 - 1950 | ⌀ 2013 - 2023 | +/- |
|---|---|---|---|
| Jan | 2.28 | 3.52 | 1.24 |
| Feb | 1.82 | 2.69 | 0.87 |
| Mar | 1.33 | 2.23 | 0.90 |
| Apr | 1.70 | 1.40 | -0.30 |
| May | 1.68 | 1.62 | -0.06 |
| Jun | 1.09 | 1.80 | 0.72 |
| Jul | 1.42 | 1.31 | -0.12 |
| Aug | 1.43 | 2.21 | 0.77 |
| Sep | 1.70 | 2.13 | 0.43 |
| Oct | 2.36 | 3.65 | 1.29 |
| Nov | 3.13 | 4.54 | 1.41 |
| Dec | 2.36 | 3.79 | 1.43 |
| ⌀ Month | 1.86 | 2.57 | 0.72 |
Snow (mm)
| Month | ⌀ 1940 - 1950 | ⌀ 2013 - 2023 | +/- |
|---|---|---|---|
| Jan | 0.15 | 0.04 | -0.11 |
| Feb | 0.11 | 0.02 | -0.09 |
| Mar | 0.00 | 0.08 | 0.08 |
| Apr | 0.00 | 0.00 | 0.00 |
| May | 0.00 | 0.00 | 0.00 |
| Jun | 0.00 | 0.00 | 0.00 |
| Jul | 0.00 | 0.00 | 0.00 |
| Aug | 0.00 | 0.00 | 0.00 |
| Sep | 0.00 | 0.00 | 0.00 |
| Oct | 0.00 | 0.00 | 0.00 |
| Nov | 0.00 | 0.01 | 0.01 |
| Dec | 0.02 | 0.02 | -0.00 |
| ⌀ Month | 0.02 | 0.01 | -0.01 |