Climate Change Chart of St. Gallen, Switzerland
Comprehensive Climate Change Chart of St. Gallen, Switzerland: Monthly Averages and Impact Trends
Explore the changing climate in St. Gallen, Switzerland with insights into temperature, rainfall, snowfall, and sunshine duration. Discover how the climate has evolved from 1940 to 1950 compared to 2013 to 2024.
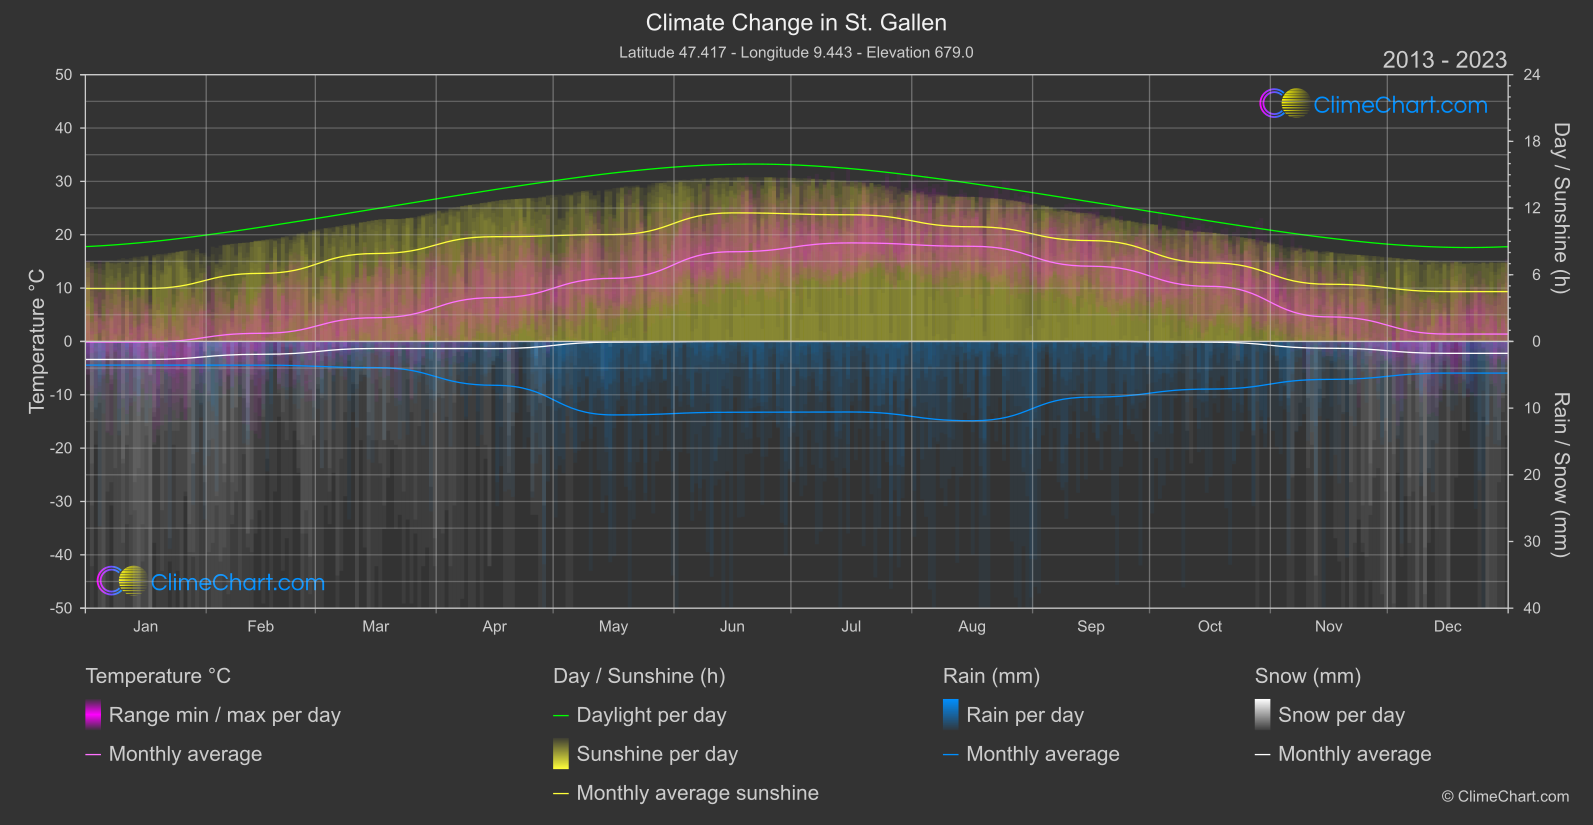
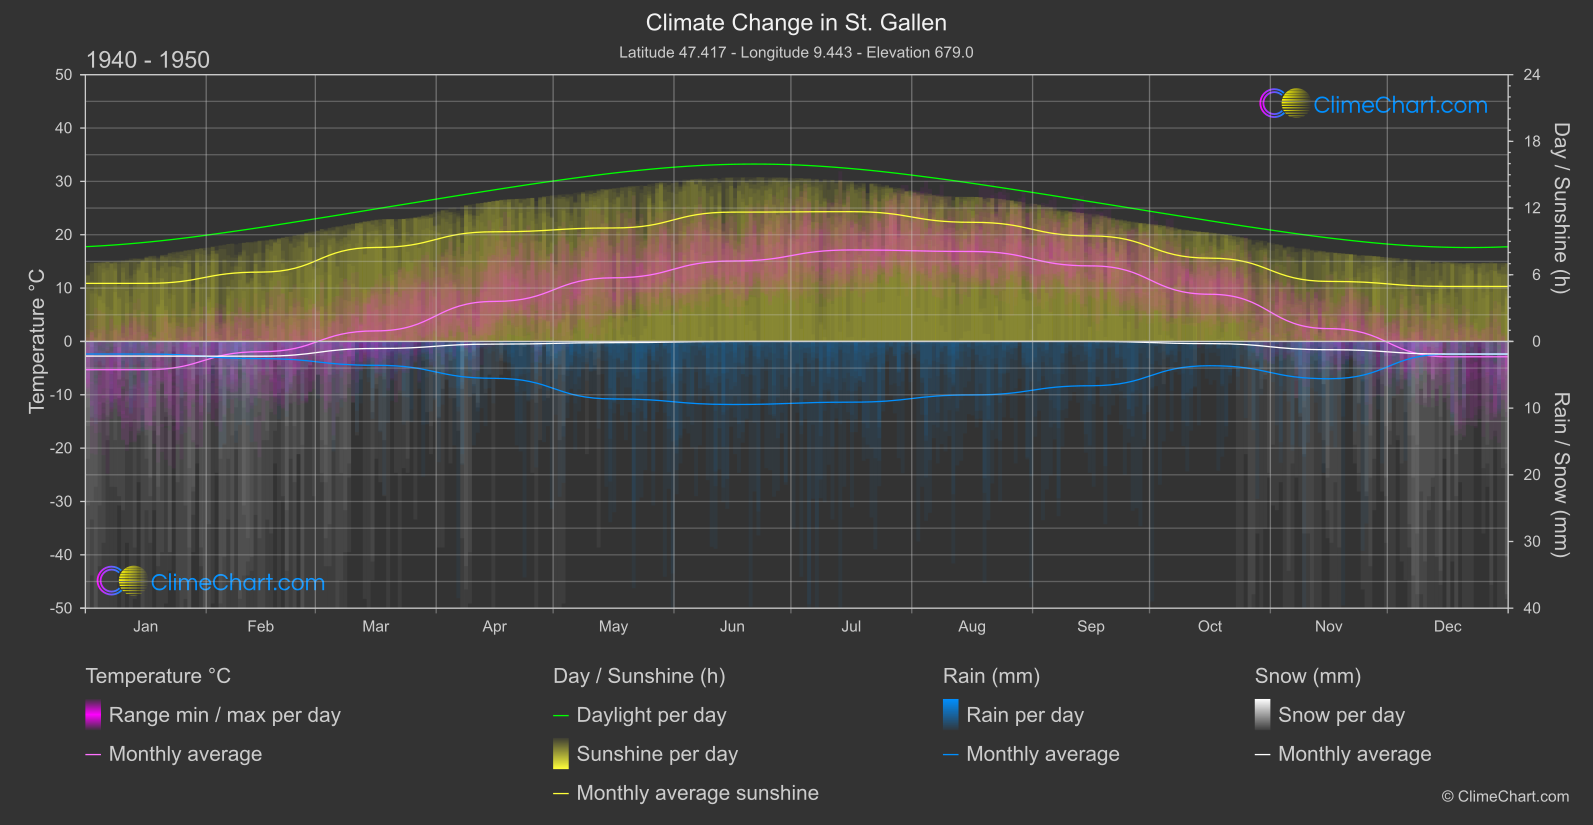
St. Gallen, Switzerland, experiences notable changes in climate parameters over the years. The data shows that the month with the highest change in temperature is January, with a significant increase from -5.30°C to -0.12°C. On the other hand, the month with the highest change in rainfall is August, showing an increase of 1.94mm. Snowfall has decreased in various months, with May experiencing the most significant drop. Sunshine duration has also decreased, with March showing the largest decline of 0.55 hours.
Climate Change Data Overview for St. Gallen, Switzerland
Explore the comprehensive climate change data for St. Gallen, Switzerland. This detailed table provides valuable insights into temperature variations, precipitation levels, and seasonal changes influenced by climate change, helping you understand the unique weather patterns of this region.
Temperature °C
| Month | ⌀ 1940 - 1950 | ⌀ 2013 - 2023 | +/- |
|---|---|---|---|
| Jan | -5.30 | -0.12 | 5.18 |
| Feb | -1.92 | 1.52 | 3.44 |
| Mar | 1.97 | 4.44 | 2.47 |
| Apr | 7.50 | 8.21 | 0.71 |
| May | 11.93 | 11.83 | -0.09 |
| Jun | 15.07 | 16.81 | 1.74 |
| Jul | 17.15 | 18.47 | 1.32 |
| Aug | 16.86 | 17.83 | 0.97 |
| Sep | 14.16 | 14.10 | -0.06 |
| Oct | 8.84 | 10.33 | 1.48 |
| Nov | 2.40 | 4.60 | 2.20 |
| Dec | -2.87 | 1.38 | 4.25 |
| ⌀ Month | 7.15 | 9.12 | 1.97 |
Sunshine (h)
| Month | ⌀ 1940 - 1950 | ⌀ 2013 - 2023 | +/- |
|---|---|---|---|
| Jan | 5.22 | 4.76 | -0.46 |
| Feb | 6.24 | 6.12 | -0.11 |
| Mar | 8.46 | 7.91 | -0.55 |
| Apr | 9.87 | 9.42 | -0.44 |
| May | 10.21 | 9.62 | -0.59 |
| Jun | 11.63 | 11.57 | -0.07 |
| Jul | 11.68 | 11.40 | -0.28 |
| Aug | 10.72 | 10.32 | -0.40 |
| Sep | 9.49 | 9.07 | -0.42 |
| Oct | 7.49 | 7.07 | -0.42 |
| Nov | 5.40 | 5.14 | -0.26 |
| Dec | 4.95 | 4.48 | -0.46 |
| ⌀ Month | 8.45 | 8.07 | -0.37 |
Rain (mm)
| Month | ⌀ 1940 - 1950 | ⌀ 2013 - 2023 | +/- |
|---|---|---|---|
| Jan | 0.94 | 1.78 | 0.83 |
| Feb | 1.29 | 1.78 | 0.49 |
| Mar | 1.79 | 1.96 | 0.17 |
| Apr | 2.77 | 3.29 | 0.52 |
| May | 4.31 | 5.51 | 1.20 |
| Jun | 4.73 | 5.31 | 0.58 |
| Jul | 4.55 | 5.29 | 0.74 |
| Aug | 4.01 | 5.95 | 1.94 |
| Sep | 3.32 | 4.17 | 0.85 |
| Oct | 1.82 | 3.57 | 1.75 |
| Nov | 2.80 | 2.85 | 0.05 |
| Dec | 0.95 | 2.37 | 1.42 |
| ⌀ Month | 2.77 | 3.65 | 0.88 |
Snow (mm)
| Month | ⌀ 1940 - 1950 | ⌀ 2013 - 2023 | +/- |
|---|---|---|---|
| Jan | 1.10 | 1.35 | 0.25 |
| Feb | 1.11 | 0.97 | -0.14 |
| Mar | 0.53 | 0.53 | -0.00 |
| Apr | 0.20 | 0.53 | 0.33 |
| May | 0.09 | 0.05 | -0.04 |
| Jun | 0.00 | 0.00 | 0.00 |
| Jul | 0.00 | 0.00 | 0.00 |
| Aug | 0.00 | 0.00 | 0.00 |
| Sep | 0.00 | 0.00 | 0.00 |
| Oct | 0.16 | 0.05 | -0.11 |
| Nov | 0.62 | 0.51 | -0.11 |
| Dec | 0.95 | 0.89 | -0.05 |
| ⌀ Month | 0.40 | 0.41 | 0.01 |