Climate Change Chart of Sri Jayawardenapura-Kotte, Sri Lanka
Comprehensive Climate Change Chart of Sri Jayawardenapura-Kotte, Sri Lanka: Monthly Averages and Impact Trends
Explore the climate change data for Sri Jayawardenapura-Kotte, Sri Lanka, showcasing insights on temperature, rainfall, and sunshine duration over the years.
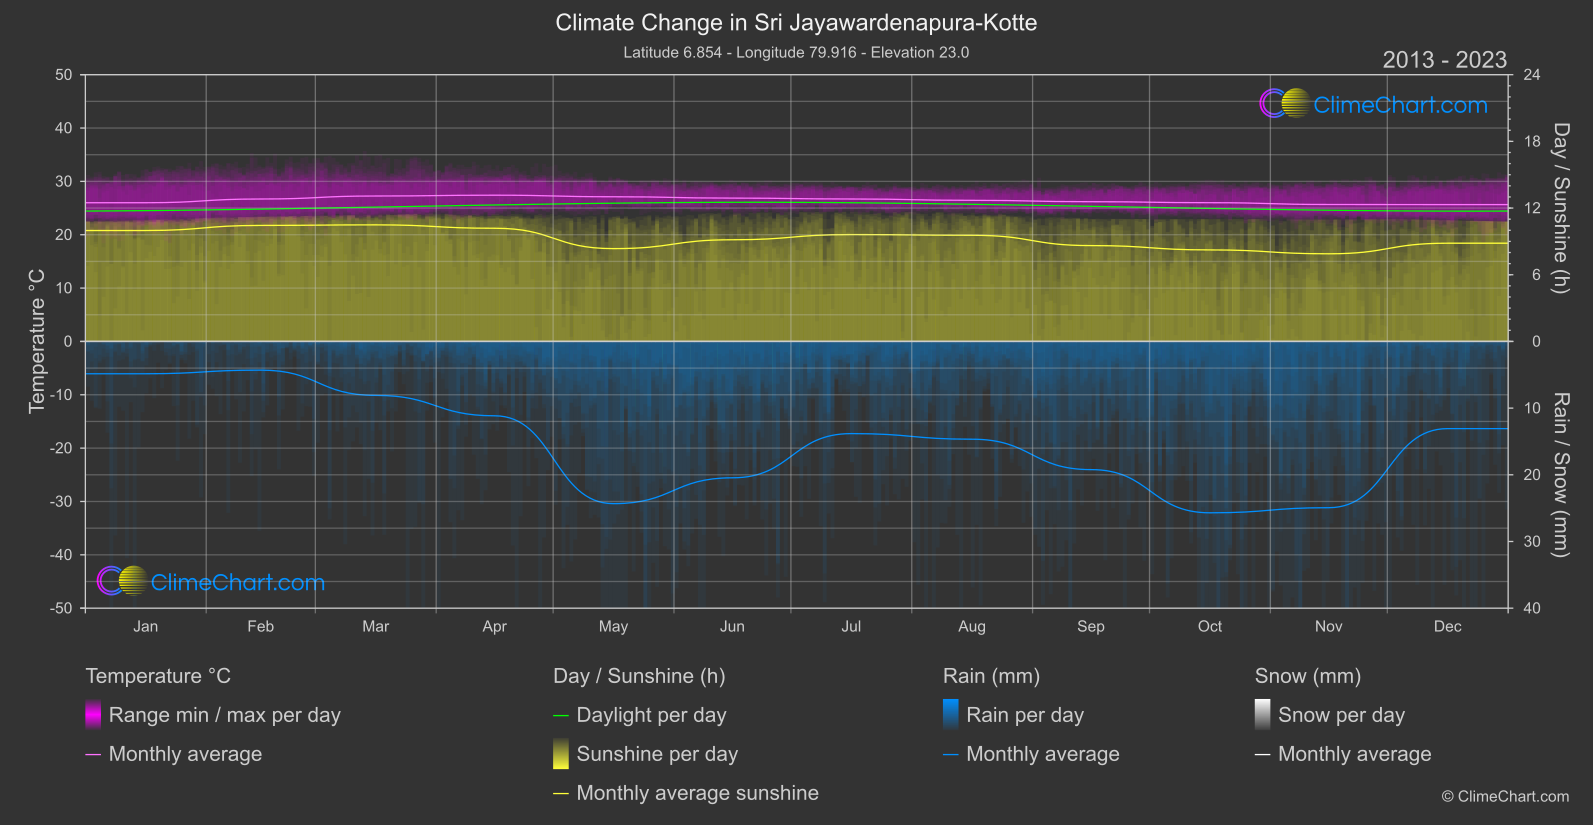
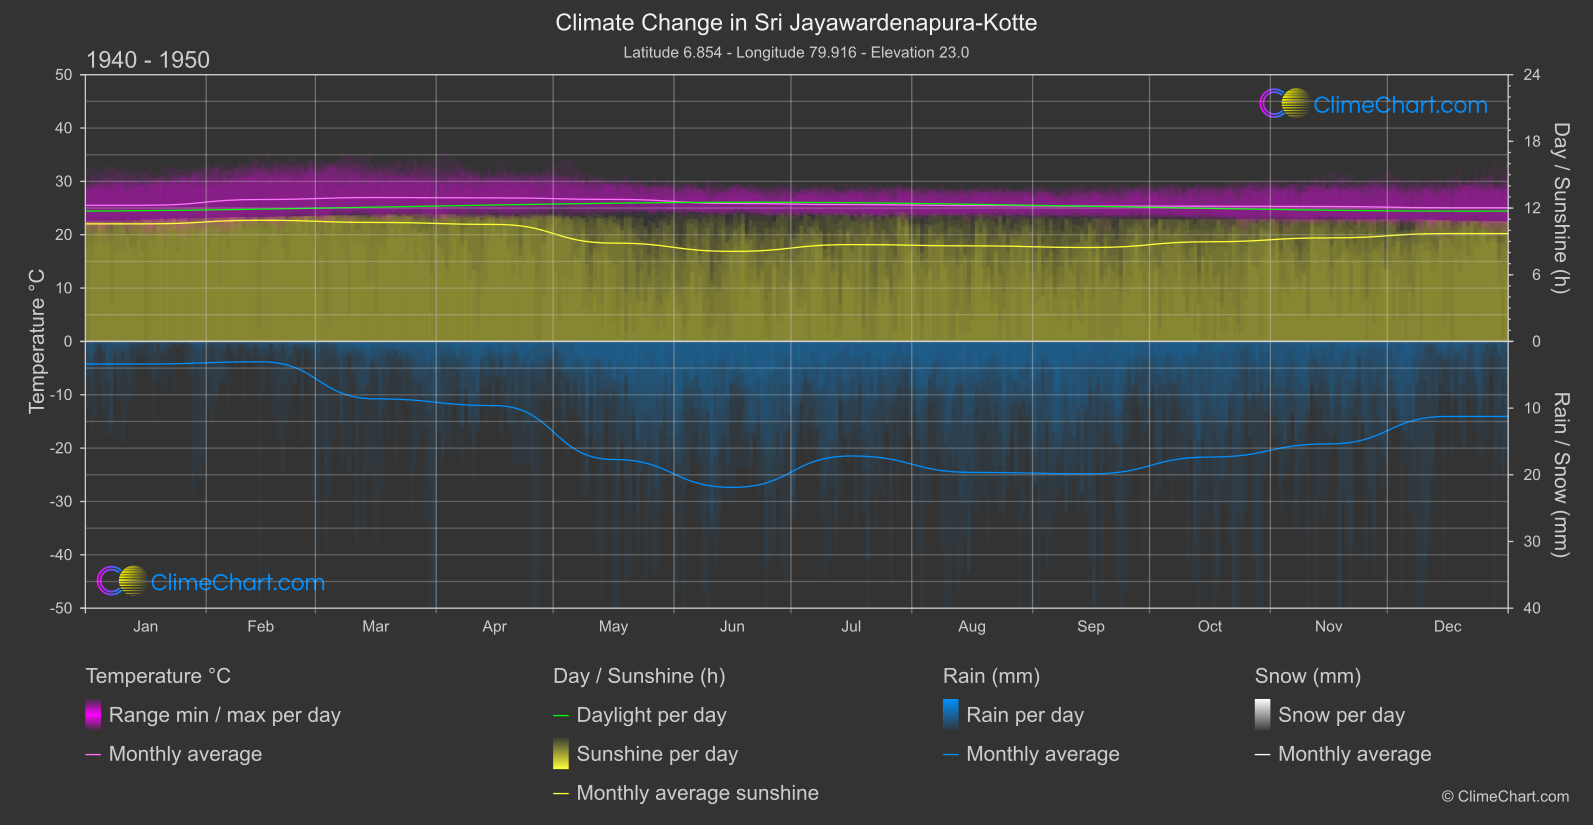
In Sri Jayawardenapura-Kotte, Sri Lanka, the data reveals significant changes in temperature, rainfall, and sunshine duration from the 1940s to the present period. Notable insights include a substantial increase in temperatures during June and July, while rainfall patterns show variations in different months with October and November experiencing the most significant changes. Furthermore, the sunshine duration has fluctuated over time, with notable decreases in sunshine hours during certain months.
Climate Change Data Overview for Sri Jayawardenapura-Kotte, Sri Lanka
Explore the comprehensive climate change data for Sri Jayawardenapura-Kotte, Sri Lanka. This detailed table provides valuable insights into temperature variations, precipitation levels, and seasonal changes influenced by climate change, helping you understand the unique weather patterns of this region.
Temperature °C
| Month | ⌀ 1940 - 1950 | ⌀ 2013 - 2023 | +/- |
|---|---|---|---|
| Jan | 25.52 | 26.00 | 0.48 |
| Feb | 26.61 | 26.70 | 0.09 |
| Mar | 26.98 | 27.26 | 0.28 |
| Apr | 26.91 | 27.41 | 0.50 |
| May | 26.63 | 27.12 | 0.49 |
| Jun | 25.86 | 26.87 | 1.00 |
| Jul | 25.64 | 26.70 | 1.06 |
| Aug | 25.48 | 26.45 | 0.97 |
| Sep | 25.37 | 26.19 | 0.82 |
| Oct | 25.35 | 26.00 | 0.65 |
| Nov | 25.29 | 25.67 | 0.38 |
| Dec | 25.05 | 25.65 | 0.59 |
| ⌀ Month | 25.89 | 26.50 | 0.61 |
Sunshine (h)
| Month | ⌀ 1940 - 1950 | ⌀ 2013 - 2023 | +/- |
|---|---|---|---|
| Jan | 10.58 | 9.98 | -0.60 |
| Feb | 10.90 | 10.44 | -0.46 |
| Mar | 10.70 | 10.49 | -0.22 |
| Apr | 10.53 | 10.18 | -0.35 |
| May | 8.85 | 8.35 | -0.50 |
| Jun | 8.10 | 9.15 | 1.04 |
| Jul | 8.71 | 9.62 | 0.90 |
| Aug | 8.60 | 9.55 | 0.95 |
| Sep | 8.45 | 8.62 | 0.17 |
| Oct | 8.97 | 8.23 | -0.73 |
| Nov | 9.32 | 7.89 | -1.43 |
| Dec | 9.70 | 8.84 | -0.87 |
| ⌀ Month | 9.45 | 9.28 | -0.17 |
Rain (mm)
| Month | ⌀ 1940 - 1950 | ⌀ 2013 - 2023 | +/- |
|---|---|---|---|
| Jan | 1.69 | 2.42 | 0.73 |
| Feb | 1.53 | 2.15 | 0.63 |
| Mar | 4.31 | 4.05 | -0.26 |
| Apr | 4.81 | 5.58 | 0.77 |
| May | 8.85 | 12.16 | 3.31 |
| Jun | 10.94 | 10.22 | -0.72 |
| Jul | 8.59 | 6.91 | -1.68 |
| Aug | 9.82 | 7.33 | -2.49 |
| Sep | 9.93 | 9.61 | -0.32 |
| Oct | 8.67 | 12.85 | 4.18 |
| Nov | 7.69 | 12.47 | 4.78 |
| Dec | 5.62 | 6.54 | 0.91 |
| ⌀ Month | 6.87 | 7.69 | 0.82 |
Snow (mm)
| Month | ⌀ 1940 - 1950 | ⌀ 2013 - 2023 | +/- |
|---|---|---|---|
| Jan | 0.00 | 0.00 | 0.00 |
| Feb | 0.00 | 0.00 | 0.00 |
| Mar | 0.00 | 0.00 | 0.00 |
| Apr | 0.00 | 0.00 | 0.00 |
| May | 0.00 | 0.00 | 0.00 |
| Jun | 0.00 | 0.00 | 0.00 |
| Jul | 0.00 | 0.00 | 0.00 |
| Aug | 0.00 | 0.00 | 0.00 |
| Sep | 0.00 | 0.00 | 0.00 |
| Oct | 0.00 | 0.00 | 0.00 |
| Nov | 0.00 | 0.00 | 0.00 |
| Dec | 0.00 | 0.00 | 0.00 |
| ⌀ Month | 0.00 | 0.00 | 0.00 |